Difference between revisions of "Category:Arcadia"
From SmartWiki
(Created page with 'Category:Interface') |
|||
| Line 1: | Line 1: | ||
| + | Arcadia is SmartSimple's next generation [[interface]]. | ||
| + | |||
| + | It functions as an overlay to the existing system, which can be switched on for certain [[roles]] or for all users. | ||
| + | |||
| + | It is designed so that any existing interface configurations will not be impacted. | ||
| + | |||
| + | This includes [[Creating a Role Based Interface|role-based access]] to different [[UTA]]s, with access to the [[UTA]]s still controlled by individual [[UTA]] settings. | ||
| + | |||
| + | [[Image:ArcadiaInterface.png|border|link=]] | ||
| + | |||
| + | ==General Overview== | ||
| + | |||
| + | The overall goal of Arcadia is to attempt to reflect the scale of flexibility and functionality in the interface. | ||
| + | |||
| + | The ways that it aims to achieve this includes: | ||
| + | |||
| + | * Make your information work harder so you don't have to | ||
| + | :* Cross-tabbed standard views with drill down options - allow users to immediately see the information that is useful or pertinent to them. | ||
| + | :* New metric ([[KPI]]) feature - present user with a figure or chart without the need to create a report. | ||
| + | :* Auto-mapping feature - show contact or organization information on a map. | ||
| + | :* Auto-linked reports | ||
| + | |||
| + | * Easier to use | ||
| + | :* Less clicks to get where you want to go. | ||
| + | :* Simpler presentation of information | ||
| + | |||
| + | * Broader use of export capabilities | ||
| + | |||
| + | * Faster time to personalize | ||
| + | |||
[[Category:Interface]] | [[Category:Interface]] | ||
Revision as of 09:42, 25 June 2013
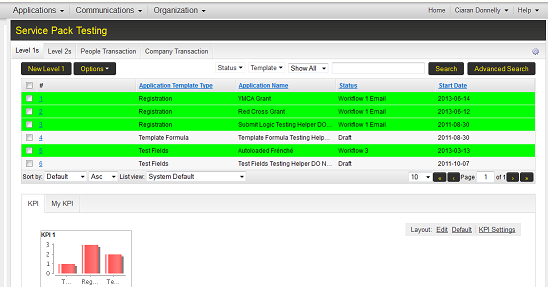
Arcadia is SmartSimple's next generation interface.
It functions as an overlay to the existing system, which can be switched on for certain roles or for all users.
It is designed so that any existing interface configurations will not be impacted.
This includes role-based access to different UTAs, with access to the UTAs still controlled by individual UTA settings.
General Overview
The overall goal of Arcadia is to attempt to reflect the scale of flexibility and functionality in the interface.
The ways that it aims to achieve this includes:
- Make your information work harder so you don't have to
- Cross-tabbed standard views with drill down options - allow users to immediately see the information that is useful or pertinent to them.
- New metric (KPI) feature - present user with a figure or chart without the need to create a report.
- Auto-mapping feature - show contact or organization information on a map.
- Auto-linked reports
- Easier to use
- Less clicks to get where you want to go.
- Simpler presentation of information
- Broader use of export capabilities
- Faster time to personalize
Pages in category ‘Arcadia’
The following 15 pages are in this category, out of 15 total.
