Difference between revisions of "Reports"
| Line 49: | Line 49: | ||
<pre> Each dashboard needs to be permissioned for the roles that you wish to be able to see the dashboard. </pre> | <pre> Each dashboard needs to be permissioned for the roles that you wish to be able to see the dashboard. </pre> | ||
| − | === | + | ===Tables=== |
In order to make the creation of reports a little simpler, some of the [[SmartSimple]] tables are presented in a [http://en.wikipedia.org/wiki/Denormalization denormalized] format when using the [[Report Builder (Neo)|Report Builder]]. | In order to make the creation of reports a little simpler, some of the [[SmartSimple]] tables are presented in a [http://en.wikipedia.org/wiki/Denormalization denormalized] format when using the [[Report Builder (Neo)|Report Builder]]. | ||
| Line 99: | Line 99: | ||
The list view of available system reports will be displayed. | The list view of available system reports will be displayed. | ||
| − | ::: '''[[File:Report list.png| | + | ::: '''[[File:Report list.png|1000px|border]]''' |
The report window consists of the following sections along the top row of tabs: | The report window consists of the following sections along the top row of tabs: | ||
| Line 108: | Line 108: | ||
:* '''Deleted Reports: '''This tab displays a list of any deleted reports in your system. | :* '''Deleted Reports: '''This tab displays a list of any deleted reports in your system. | ||
You can filter the results of your report list by choosing a '''Category '''of reports - this can be found at the top right of your page. Any reports that have not been associated with a category will appear in the '''Uncategorized '''category option. Clicking into the '''Category '''field will allow a drop-down list of available report categories to appear: | You can filter the results of your report list by choosing a '''Category '''of reports - this can be found at the top right of your page. Any reports that have not been associated with a category will appear in the '''Uncategorized '''category option. Clicking into the '''Category '''field will allow a drop-down list of available report categories to appear: | ||
| − | :: [[File:Reports category.png| | + | :: [[File:Reports category.png|250px|border]] |
You can also search through reports manually by using the Search bar on the top right, just above the list view. If your results exceed the maximum amount of records displayed on a page, toggle between different pages by selecting the '''next '''or '''back '''arrow icons on the top right. The count of records that you are viewing out of the total will always be displayed next to these buttons. | You can also search through reports manually by using the Search bar on the top right, just above the list view. If your results exceed the maximum amount of records displayed on a page, toggle between different pages by selecting the '''next '''or '''back '''arrow icons on the top right. The count of records that you are viewing out of the total will always be displayed next to these buttons. | ||
Any [[Internet Enabled Reports|reports that have been Internet-enabled]] will have a black dot under the '''Internet Enabled '''column to indicate so. | Any [[Internet Enabled Reports|reports that have been Internet-enabled]] will have a black dot under the '''Internet Enabled '''column to indicate so. | ||
Revision as of 09:39, 2 July 2019
Overview
The SmartSimple reporting system, an integral part of our business operating system, allows you to manipulate both the contents and the presentation of data contained in one or more of the SmartSimple tables. Unlike a table, reports present only the data that meets the criteria you define - they can also aggregate and display summarized data information.
You can utilize the functionality of reports in your SmartSimple instance without additionally buying or installing software. Reports are completely created from within the standard interface and are viewable from any browser, as well as via 'Microsoft 'Word or Excel with the appropriate SmartSimple plug-in.
Benefits of Reports:
- Display data from one or more tables in one place
- Group-aggregate data from one or more table
- Display the grouped data in a variety of different types of graphs
- Export the data into any file format that you wish OR
- Designate Internet-enabling so that the reports can be linked to public websites
- Group reports together as tabs, allowing similar topic-based reports to be found together
- Copy and modify built-in reports as the basis of your customized reports
User Role-based security defines who can view the reports that you create from your system.
You must be a user with SysAdmin privileges in order to create reports from your SmartSimple system.
Report Components
You will encounter three major components in the reporting system:
- Reports that are created from underlying SmartSimple database tables - you can connect the required tables to generate a report
- Graphs that you create yourself. These are based on existing reports and are used to display the report in a graphic format.
- Dashboards that will display multiple charts on a single page
The following diagram shows the relationship between these three types of entities:
.jpg)
Charts
Charts are used to display the information from a report in an easy-to-read “graphic” format.
- You can create pie charts, bar charts, line charts, and table-type charts.
- You can create more than one chart type of each report and when displaying a report, choose from any of the charts associated with the report.
- Generally, you will choose a “summary” type report as the basis for the chart, as that type of information is more meaningful when displayed in this manner.
A user can only access the chart if they have permission to see the report that the chart is based on.
A user can only access the chart if they have permission to see the report the chart is based on.
Dashboards
A dashboard is a single page view of a set of charts.
- When the user displays the dashboard, each report referenced by each chart is processed, and the current data is displayed in charts that are displayed on the dashboard.
- You can create multiple dashboards to show different sets of key indicators.
- A user can indicate that a specific dashboard should be their home page within SmartSimple, giving them an immediate view of key information from the system when they first log in.
Each dashboard needs to be permissioned for the roles that you wish to be able to see the dashboard.
Tables
In order to make the creation of reports a little simpler, some of the SmartSimple tables are presented in a denormalized format when using the Report Builder.
For example, the contact record does not contain the company name; these two tables are linked at the database level through the CompanyID field. So contact table does not contain the company name field but rather a key field that links to the company table.
But when you use the contact table within the Report Builder it will display a field Company Name. This means that you can use this field without needing to link the two tables together.
Configuration - Essentials
Permissioning Reports
Access to the report-creation features is controlled by the role-based manager permission. So you must be in a role associated with this feature in order to create reports.
Users who will only view reports do not need these manager permissions.
You must be a member of a role with manager permission for Reports if you wish to do any of the following actions:
- Create new reports.
- Edit or copy existing reports.
- Delete existing reports, either individual or as batch deletes.
To permission which roles will have the ability to create, edit, and delete reports in your system, follow these steps:
1. Click on the 9-square menu icon on the top right of your page.

2. Under the heading Configuration, select Roles and Security.

3. Under the subheading System Security Settings, select the hyperlink System Feature Permissions.
4. Click into the tab labelled Action Permission.

5. Scroll down until you see the field labelled Reports - Manager. Click into the text box in order to select from a drop-down of user roles that will have manager permissions for reports.
-
-
- You can also specifically permission which roles will have the ability to 'Export 'Data from reports.

6. Click Save at the bottom of the screen when you are done.
Accessing Reports
A user who is permissioned for report use can access the reports available to them. Follow these steps to access reports in your SmartSimple system:
1. Click the 9-square menu icon on the top right of your page.
2. Under the heading Tools, select Reports.

The list view of available system reports will be displayed.

The report window consists of the following sections along the top row of tabs:
- Reports: This displays a list of your system's current reports that have been made available to you.
- Global Report Template: This tab is used to define a customized HTML template for all reports.
- Dashboards:
- Web Access Statistics: This tab displays statistics on how often your web-enabled reports have been accessed.
- Deleted Reports: This tab displays a list of any deleted reports in your system.
You can filter the results of your report list by choosing a Category of reports - this can be found at the top right of your page. Any reports that have not been associated with a category will appear in the Uncategorized category option. Clicking into the Category field will allow a drop-down list of available report categories to appear:

You can also search through reports manually by using the Search bar on the top right, just above the list view. If your results exceed the maximum amount of records displayed on a page, toggle between different pages by selecting the next or back arrow icons on the top right. The count of records that you are viewing out of the total will always be displayed next to these buttons. Any reports that have been Internet-enabled will have a black dot under the Internet Enabled column to indicate so.
Report List Columns
Each report on the main list of reports will have buttons to the left of it that have several different functions. The functions are described in the table below:
| Run Report |
Clicking this icon will cause the system to run the report and display the results to you. |
| Custom Export |
Clicking this icon will allow you to configure the information that you wish to export from your SmartSimple report to external applications such as MS Word, MS Excel, or Quickbooks. |
| Export File |
Clicking this icon will allow you to export your SmartSimple report to external applications in a standard file format such as MS Word, MS Excel, PDF, HTML or more. There is less configurability available with the Export File function than the Custom Export function. |
| Edit Report |
Click this icon in order to open the edit options for this report. If the report is a built-in report, you will be able to edit the report to see how it is constructed, but any modifications you make will not be saved to the built-in report. In order to customize a report you will have to make a copy of the built-in report and make further edits with the copy. |
- Any reports that are not enabled for certain features - for example, for File Export or Custom Export - will have the corresponding button icon greyed out next to the report name.
- In order to enable these features, simply click the pencil icon next to the report name, go to the appropriate tab of Custom or File Export, ensure that it is both enabled and set up to how you want it, then click Save. When you return to the list view of reports, the corresponding icon should now be clickable.
The columns on the list view of reports are described in the following table:
| Report Number (#) | The index of the report on the page. Remember this page length, like all others, is set by your Personal Settings - Number of Records Per Page. |
| Report Name | The name assigned to the report. An asterisk (*) is displayed in front of the Name field of any built-in reports. |
| Report Description | The narrative description of the report. |
| Roles | This will display a list of roles that will be able to display the report. You must add the required roles to this list in order to make it available to other users. If you are in a role with manager permissions for reports, you are able to see all reports, even though the Roles field may be blank. |
| Last Updated | This will display a date and time stamp for when the report was last updated. |
| Modified By | This will display the name of who made the last modifications to this report. |
| Created By | This will display the name of who created the report initially. |
| Internet Enabled | If the report is not Internet Enabled, the column will be blank. If the report is Internet Enabled, the column will have a black dot. |
| Report ID | See Determining the reportid. |
Remember: Any user will only be able to see the reports and functions that they have permissions to. If a user is permissioned to be able to create new reports, they will see a + icon on the top left that allows them to create a new report.
Creating a Basic Report
Learn how to create a basic report by following the steps below. Prior to these steps, you must first be in the Reports list view (read the Accessing Reports section if you need help).
- Note: If you have many Custom Fields, access the reports tab within the application you are creating the report from. If you are creating a report from a particular , access the reports tab from that UTA.
1. Click the + icon on the top left of the screen to Create a New Report.
2. The new report window is displayed:

The fields on the new report page are described below:
| Report ID | The unique ID assigned to the report, shown as a read-only field. |
| Builder Type |
When creating a report, users will have the option to choose between the Neo or Classic Report-Builder. Neo - See for now, Report Builder (Neo), a SmartSimple upgrade to the Reports tool that is meant to be more user-friendly and intuitive to use. Classic - Selecting the Classic builder type will enable a new tab called Recordsets to appear in the top row of tabs. This tab is used to select which tables are required in the report, the relationships between tables, and the primary table. The primary table determines how the data will be joined when multiple tables are selected. |
| Name | The name of the report will be displayed to any users who are accessing the report. |
| Description | The narrative description of the purpose of the report. |
| Category | The category you wish you associate with this report. Entering a unique category name will consequently create a new entry in the Category field in the main Reports list view. Entering an existing category name will display this report in the existing category. |
| Lock | Do not build rebuild report - Toggling on this option will indicate that the report should not be rebuilt. In the case of a custom Report Template, it will set off an alert when the Report Builder button is clicked. |
Editing Reports
After clicking the Save button, the page will reload and save your report into the system. You will now be in the position to edit this report with more detailed configuration.

The Builder Type will no longer be modifiable once you have saved your new report. Furthermore, the main report information will now include the Created By, Last Modified, and Last Modified By auto-populated fields.
You will also be able to see the following new buttons at the bottom of the page: Save, Save As, Delete, and Preview.
- If you have not yet selected any table(s) nor fields from tables in your Report Builder, you will not be able to see a preview of the report.
- The Save As button will enable a pop-up to appear that prompts you to enter the new name of your report, making a copy of this report under a new name.
To the right of the page will be the Notes tab that allows you to make new notes or see any existing notes that have been made on your report.
Classic Report Builder
If you selected Classic Builder Type for this report, the following tabs will appear after the General Settings tab:
| Recordsets | This tab allows you to attach recordsets to your reports. |
| Advanced | This tab allows you to configure the advanced settings of your report. |
| Security | This tab allows you to permission the security of your report. A field labelled Allow View Report will enable you to select which roles have permission to see this report in your system. |
| Sub-Reports | This tab allows you to build a "nested" report within the main report. |
| File Export | This tab allows you to the default export settings of the report. |
| Custom Export | This tab allows you to create custom export settings for the report. |
| Scheduled Export | This tab allows you to schedule an export for a later date, which can be set to either [[Custom Export |
| Report Template | This tab allows you to control the layout and formatting of your report. |
| Charts | This tab allows you to create one or more charts to be associated with the report. |
Each Classic Report Builder tab will soon have its own subsection within this article for further explanation, if needed.
- Note: In Report Builder Neo, the only difference is that you will not see a Sub-Reports tab.
Adding a Table to a Report
The first step is always to add the tables required to the report on the Recordsets tab.1. Scroll and set the Primary table option for the Contacts table.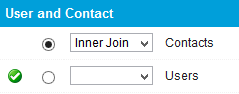 Selecting the primary table automatically selects that table for the report.
Launching the Report Builder
Once you have Saved your new report with the Builder Type - Classic selected, a four square icon will appear at the top left of your page above the report name.:: ![]() Clicking on this icon will launch a modal window that displays the Classic Report Builder. ::
Clicking on this icon will launch a modal window that displays the Classic Report Builder. :: 
Configuration - Advanced
Advanced Settings of Reports
The second tab on the New Report page is labelled Advanced. This tab will display all the advanced settings that can be configured for the report.::  The options for the Advanced tab are described in the table below:{| class="wikitable"
Criteria TextText used to prompt the user when they are required to enter some criteria values. Use this setting to specify the introduction text as well as labels for custom fields. Labels are defined by a hyphen (-) preceding the label and are applied to the criteria fields in the order that they are entered.View Mode
The options for the Advanced tab are described in the table below:{| class="wikitable"
Criteria TextText used to prompt the user when they are required to enter some criteria values. Use this setting to specify the introduction text as well as labels for custom fields. Labels are defined by a hyphen (-) preceding the label and are applied to the criteria fields in the order that they are entered.View Mode
List View - Selecting this option will allow all the records to appear in a list.
Single Record View - Selecting this option means that each report will be displayed one at a time.
'External Access'Internet Enabled - Displays a URL that allows the report to be accessed over the internet without the need for a user to log into the system. This setting is useful for creating public reports.OData Connector
Enabled Version 2,3,4 -
Uses Open Data Protocol to simplify data sharing across disparate applications in enterprise, Cloud, and mobile devices.
Disable Global TemplateDisables the Global Report Template for this specific report.Record LimitDetermines the maximum number of records returned in the report.Interactive View Display
None -
Display Link to Interactive View -
Open Report Directly in Interactive View -
Total Label
Other Options
Enable Translation - Allows report headers, and associated charts, to use translation options in Language Library.
Enable Straight Join - See Straight Join.
Enable Pivot View - Enables pivot functionality. When grouping by two different columns, you now have the option to perform an aggregate function and pivot the grouped columns across the x/y axis.
Merge Sub-Reports - See Merge Sub-Reports.
No Name URL Parameter - See Enable URL Parameter Encryption.
Hide Custom Export - This will hide the ability for Custom Export for this report.
Hide File Export - This will hide the ability for File Export for this report.
Report and Field Caching
Scrolling further down the Advanced Settings tab will allow you to modify the functionality of caching for reports and field.

| Report Caching |
Caching Options: Enable - Caching Options: Cache By User - Cache Life Span - |
| Field Caching |
Frequency - Identifier Column - Column Field Value Column - Custom Field - Last Run - |