Difference between revisions of "Report Builder Column Settings"
| Line 16: | Line 16: | ||
* '''Sort By''' - Determines the display order of the report results, '''Ascending''' or '''Descending'''. | * '''Sort By''' - Determines the display order of the report results, '''Ascending''' or '''Descending'''. | ||
* '''Align''' - Determines the alignment of the column header and the column values. Options are ''Left'' (the default setting), ''Center'' and ''Right''. | * '''Align''' - Determines the alignment of the column header and the column values. Options are ''Left'' (the default setting), ''Center'' and ''Right''. | ||
| − | * '''[[Calculated Field]]''' - Allows you to build out further complexity such as mathematical operators, concatenation, and supports | + | * '''[[Calculated Field]]''' - Allows you to build out further complexity such as mathematical operators, concatenation, and supports MySQL syntax. For additional information, please see the '''Calculated Field''' tab in the Report Builder or [[Calculated Field|this article]]. |
* '''Show''' - This flag is used to suppress the display of a field that you may need to use for criteria, but not display in the reports. For example, you may wish to produce a list of salaries over 100,000 per year and use the salary as criteria, but not show the result. | * '''Show''' - This flag is used to suppress the display of a field that you may need to use for criteria, but not display in the reports. For example, you may wish to produce a list of salaries over 100,000 per year and use the salary as criteria, but not show the result. | ||
* '''[[Changing the Column Display Order in a Report|Move Icons]]''' - '''Move Left''' and '''Move Right''' icons are displayed to the left and right of each '''Show''' check box. [[Image:Reps7.png]] These buttons are used to change the column order. | * '''[[Changing the Column Display Order in a Report|Move Icons]]''' - '''Move Left''' and '''Move Right''' icons are displayed to the left and right of each '''Show''' check box. [[Image:Reps7.png]] These buttons are used to change the column order. | ||
Revision as of 08:02, 13 September 2013

The report builder window consists of two panels.
The top panel is used to construct the report by selected the required fields and setting the way the field should be used within the report.
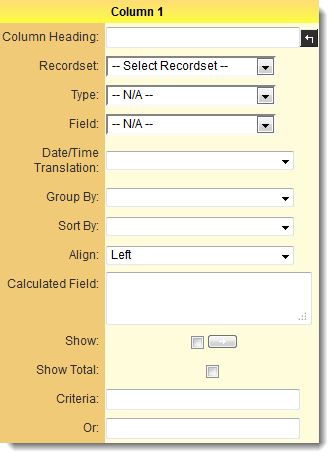
Each report column consists of the following settings:
- Column Heading - The text you wish to appear above each column in the report. Initially, this will be set to the same name as the field, but you can edit the text if required. If you wish to change the text back to the Field name, then click the button to the right of the column heading.

- Recordset - Refers to the recordset selected in the Recordsets tab. If multiple Recordsets have been selected to build your report, you can select from them in this dropdown.
- Type - When the Table has been selected, you can select the category, role, template or type from which your field will be derived.
- Field - The field you wish to display in this column. All fields from all selected tables will be displayed in the field list. Fields are sorted alphabetically by table name, and by field name.
- Date/Time Translation - Used to “extract” the day, month, week, or year from a date field for comparison purposes.
- Group By - Used in summary reports to group by, sum, count, or calculate the average of the field.
- Sort By - Determines the display order of the report results, Ascending or Descending.
- Align - Determines the alignment of the column header and the column values. Options are Left (the default setting), Center and Right.
- Calculated Field - Allows you to build out further complexity such as mathematical operators, concatenation, and supports MySQL syntax. For additional information, please see the Calculated Field tab in the Report Builder or this article.
- Show - This flag is used to suppress the display of a field that you may need to use for criteria, but not display in the reports. For example, you may wish to produce a list of salaries over 100,000 per year and use the salary as criteria, but not show the result.
- Move Icons - Move Left and Move Right icons are displayed to the left and right of each Show check box.
 These buttons are used to change the column order.
 - Criteria - Sets the criteria for the records to be displayed in the report. There are ten rows for criteria.
Initially, the report will be configured for 15 columns, but you can increase the number of columns in increments of 15 by clicking the more columns button.
There is a fixed limit of 30 columns in any report. If more columns are required you will need to use two reports linked together. (See Merge Sub-Reports)
Note: If you have many custom fields, access the reports tab within the application you are creating the report from. If you are creating a report from a particular UTA, access the reports tab from that UTA.
Note: Also, Mozilla Firefox will load the report builder faster than Internet Explorer.
Report Builder Action Buttons
The following buttons are visible at the bottom of the Report Builder page, just above the Help Panel:
-
- The "Build Query" button is used to create your report based on the fields and criteria you have selected in the Report Builder. When the "Build Query" button is clicked, the report builder will close and you will be brought back to the Report Editing screen. The Report Template will also be rebuilt when "Build Query" is clicked, so if custom work has been done to the Report Template, make sure to save your changes elsewhere before rebuilding your query.
-
- This button will clear all fields, calculated fields, criteria, etc. selected in the Report Builder.
-
- This button will add another 25 columns to the Report Builder interface, to a maximum of 50.
Report Builder Help Panel
The bottom panel provides help on the Report builder, and consists of five tabs. Each displays help on a different report-related topic.
Click on each of these tabs to review the associated help.
- Overview - Describes the components of the top panel of the Report Builder.
- Comparison Operators - Describes how to set basic criteria based on logical tests. See also Setting Text Criteria – Logical Operators in a Report and Specifying Multiple Criteria in Reports.
- Wildcard and Like Operators - Describes how to set partial criteria. See also Using Wildcard Criteria in Reports and Prompting for a Criteria using a Wildcard.
- Special SmartSimple Criteria Values - Describes how to set criteria from user prompts and user attributes (user and company identifiers).
- Date Comparison - Describes how to set date- and time-based criteria. See also Using Date Criteria.
- Calculated Fields - Describes valid mathematical expressions and functions, string functions and logical statements for use in the Calculated Field section.
See Also
- Calculated Field
- Setting Text Criteria – Logical Operators in a Report
- Specifying Multiple Criteria in Reports
- Using Wildcard Criteria in Reports
- Prompting for a Criteria using a Wildcard
- Using Date Criteria

