Interactive Report View

|
This article will explain how you can implement this feature for use on your SmartSimple system. |
Contents
Interactive Report View
In this article, you will enable and run the Interactive Report View feature.
Enable the Interactive Report View
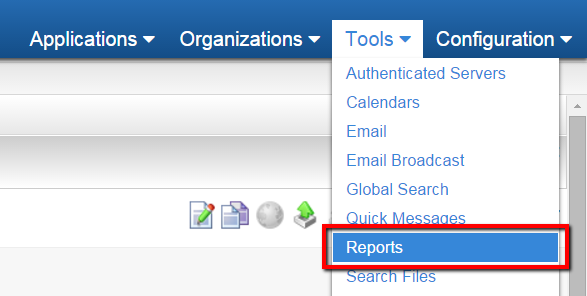
- Under the Tools menu, click on Reports
- Locate the report you wish to enable with the Interactive Report View
- Click on the Edit Report icon (icon resembles a pen on paper)
- The Report Details page is displayed
- Click on the Advanced tab
- Locate the field called Interactive View Display change value of the drop down menu to either Display Link to Interactive View or Open Report Directly in Interactive View.
- Click Save
Viewing the Interactive Report View
- Locate the report you just enabled with the Interactive Report View feature
- Click on the Run Report Icon
- If you selected the "Open Report Directly in Interactive View" option in the previous step, your report will open in the new view
- If you selected the "Display Link to Interactive View" option in the previous step, you will see the Interactive View link displayed
- The report will open in the Interactive View
Manipulating data in the Interactive Report View
In the Interactive View you can enter text queries to filter through report data, group data, sort data (ascending and descending), and calculate aggregate totals (count, sum, max, min, average).
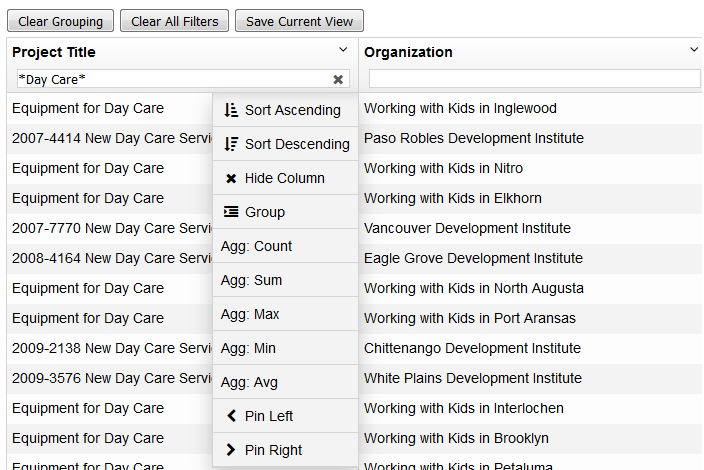
Each column within the interactive view has a drop-down, which has a number of options for manipulating the columns or the data within the columns, as well as a text field to enter filter text.
Manipulating Columns
The interactive view has a drop-down in each column, which allows users to do the following . . .
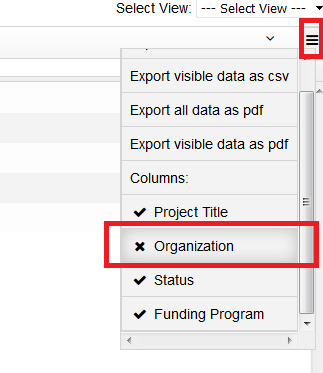
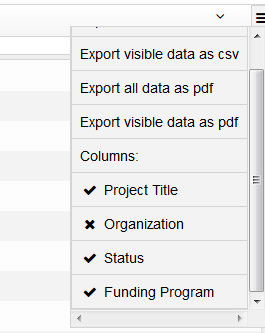
- Hide Columns: user can choose to hide a column from the current view. Any hidden columns can be exposed again by clicking on the triple bar on the right of the screen and then clicking on the hidden column NOTE: Hidden columns appear with a 'x' beside them.
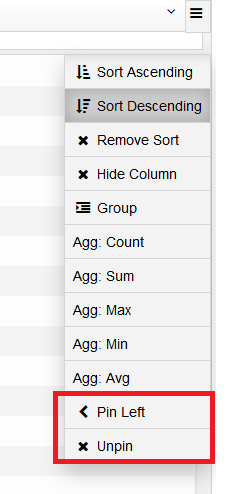
- Pin Left / Right: users can choose to move columns to the far left or right using the Pin Left or Pin Right options. Once the column has been pinned then the previously selected pin option is then replaced with an Unpin option to allow the user to restore the column to its previous location.
Filter data
Each column within the interactive view has a text field where the filter text can be entered. Users can use an asterisks (*) as a wildcard character if they wish to run a search for multiple records with similar, but not identical data.
Users can use the 'x' within the filter text field to clear the filter for individual columns.
Users can use the 'Clear All Filters' button along the top of the Interactive report to clear the filter for all columns.
Sort data
The interactive view has a drop-down in each column, which includes a Sort Ascending and Sort Descending option.
Users can use the 'Remove Sort' option within the drop-down to clear sorting within an individual column.
Group data
The interactive view has a drop-down, which includes a Grouping option.
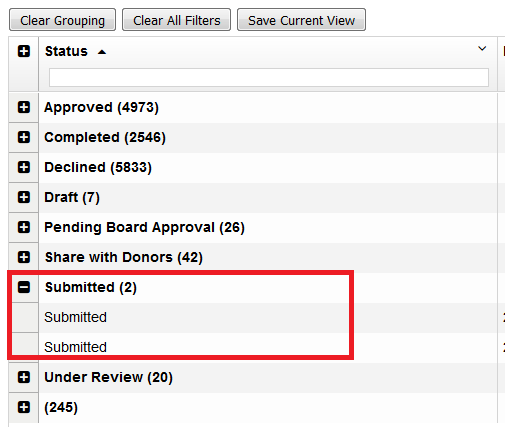
When the Grouping option is selected against a column then that column is automatically moved to the left hand side of the report. The groupings are displayed alongside a count of the number of records in each group.
Users can expand and contract all of the groupings at once, using the '+' or '-' in the column header, or for individual groupings, using the '+' or '-' option adjacent to the individual groupings.
The Grouping option can also be used in conjunction with aggregate functions
- Agg: Count
- Agg: Sum
- Agg: Max
- Agg: Min
- Agg: Avg
Users can use the 'Ungroup' option within the drop-down to clear grouping based on an individual column, or can sue the Clear Grouping button along the top to clear grouping against all columns.
Save data
Once a user has manipulated the data then they have the option to save it, with any grouping, filtering or sorting also stored.
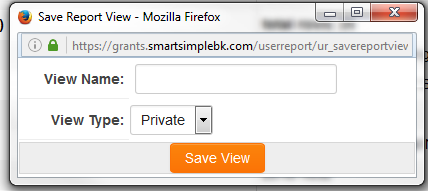
The user clicks on the Save Current View button along the top of the Interactive report and then enters a View Name and View Type.
Private View type is only accessible to current user, while Public is accessible to all users.
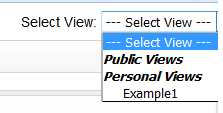
The Views are accessible from the Select View drop-down on the top right hand corner of the report.
If the current user created the view that is currently displayed then they will be able to delete using the Delete View button.
Export data
Once a user has manipulated the data then they have the option to export it, including with any grouping, filtering or sorting applied to the exported data.
Click on the triple bar on the right of the screen to expose the export options.
- Export visible data as cvs: will export data to CSV File with any grouping, filtering or sorting applied
- Export all data as pdf: will export all data to PDF File without applying any grouping, filtering or sorting applied
- Export visible data as pdf: will export data to PDF File with any grouping, filtering or sorting applied

|
Click here to learn why this feature is a benefit to your organization. |
