Reports
From SmartWiki
Overview
The SmartSimple reporting system is an integral of our business operating system. Reports provide the following features:
- No additional buying or installation of software
- All creation functionality available within the standard interface
Benefits of Reports:
- Display data from one or more tables in one place
- Group-aggregate data from one or more table
- Display the grouped data in a variety of different types of graphs
- Export the data into any file format that you wish OR
- Designate Internet-enabling so that the reports can be linked to public websites
- Group reports together as tabs, allowing similar topic-based reports to be found together
- Use built-in reports as the basis of your customized reports
User Role-based security defines who can view the reports that you create from your system.
You must be a user with SysAdmin privileges in order to create reports from your SmartSimple system.
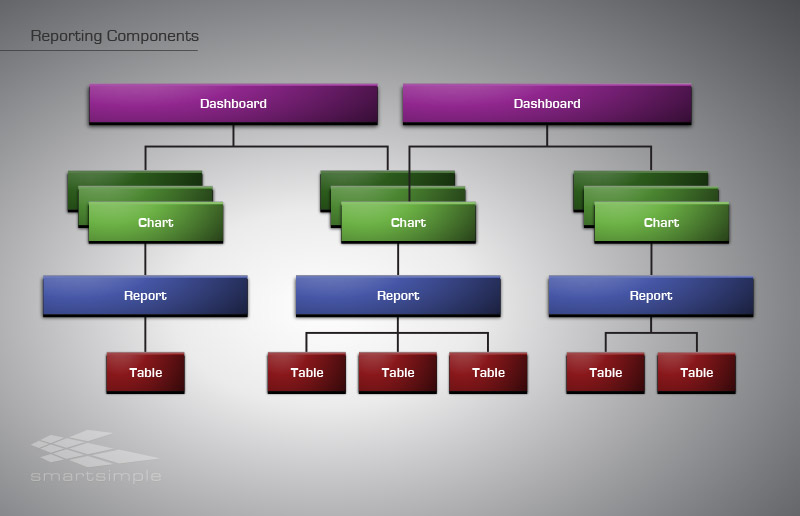
Report Components
You will encounter three major components in the reporting system:
- Reports that are created from underlying SmartSimple database tables - you can connect the required tables to generate a report
- Graphs that you create yourself. These are based on existing reports and are used to display the report in a graphic format.
- Dashboards that will display multiple charts on a single page
The following diagram shows the relationship between these three types of entities: