Difference between revisions of "Reports"
| Line 89: | Line 89: | ||
:: [[File:Reports manager permissions.png|350px|border]] | :: [[File:Reports manager permissions.png|350px|border]] | ||
| − | * You can also specifically permission which roles will have the ability to '''Export ''''''Data '''from reports. | + | : |
| − | + | :* You can also specifically permission which roles will have the ability to '''Export ''''''Data '''from reports. | |
6. Click '''Save '''at the bottom of the screen when you are done. | 6. Click '''Save '''at the bottom of the screen when you are done. | ||
| Line 98: | Line 98: | ||
1. Click the 9-square menu icon on the top right of your page. | 1. Click the 9-square menu icon on the top right of your page. | ||
| − | :: {{Icon-Menu}} | + | ::: {{Icon-Menu}} |
| + | : | ||
2. Under the heading '''Tools, '''select '''Reports. ''' | 2. Under the heading '''Tools, '''select '''Reports. ''' | ||
| − | :: [[File:Report.png|600px|border]] | + | ::: [[File:Report.png|600px|border]] |
| + | : | ||
The list view of available system reports will be displayed. | The list view of available system reports will be displayed. | ||
| − | :: [[File:Report list.png|800px|border]] | + | ::: [[File:Report list.png|800px|border]] |
| + | : | ||
The report window consists of the following sections along the top row of tabs: | The report window consists of the following sections along the top row of tabs: | ||
| − | * '''Reports: '''This displays a [[List View Overview|list]] of your system's current reports that have been made available to you. | + | :* '''Reports: '''This displays a [[List View Overview|list]] of your system's current reports that have been made available to you. |
| − | * '''[[Global Report Template]]: '''This tab is used to define a customized HTML template for all reports. | + | :* '''[[Global Report Template]]: '''This tab is used to define a customized HTML template for all reports. |
| − | * '''Dashboards: ''' | + | :* '''Dashboards: ''' |
| − | * '''[[Web Access Statistics]]: '''This tab displays statistics on how often your web-enabled reports have been accessed. | + | :* '''[[Web Access Statistics]]: '''This tab displays statistics on how often your web-enabled reports have been accessed. |
| − | * '''Deleted Reports: '''This tab displays a list of any deleted reports in your system. | + | :* '''Deleted Reports: '''This tab displays a list of any deleted reports in your system. |
| + | You can filter the results of your report list by choosing a '''Category '''of reports - this can be found at the top right of your page. Clicking into the '''Category '''field will allow a drop-down list of available report categories to appear: | ||
| + | |||
| + | :: [[File:Reports category.png|300px|border]] | ||
| + | |||
| + | You can also search through reports manually by using the Search bar on the top right, just above the list view. If your results exceed the maximum amount of records displayed on a page, toggle between different pages by selecting the '''next '''or '''back '''arrow icons on the top right. The count of records that you are viewing out of the total will always be displayed next to these buttons. | ||
| + | |||
| + | Any [[Internet Enabled Reports|reports that have been Internet-enabled]] will have a black dot under the '''Internet Enabled '''column to indicate so. | ||
| + | |||
| + | ===Report List Columns === | ||
| + | Each report on the main list of reports will have buttons to the left of it that have several different functions. The functions are described in the table below: | ||
| − | + | {| class="wikitable" | |
| + | |- | ||
| + | || | ||
| + | || | ||
| + | || | ||
| + | |- | ||
| + | || | ||
| + | || | ||
| + | || | ||
| + | |- | ||
| + | || | ||
| + | || | ||
| + | || | ||
| + | |- | ||
| + | || | ||
| + | || | ||
| + | || | ||
| + | |- | ||
| + | || | ||
| + | || | ||
| + | || | ||
| + | |- | ||
| + | || | ||
| + | || | ||
| + | || | ||
| + | |} | ||
| + | The columns on the [[List View Overview|list view]] of reports are described in the following table: | ||
| + | {| class="wikitable" | ||
| + | |- | ||
| + | || | ||
| + | || | ||
| + | |- | ||
| + | || | ||
| + | || | ||
| + | |- | ||
| + | || | ||
| + | || | ||
| + | |- | ||
| + | || | ||
| + | || | ||
| + | |- | ||
| + | || | ||
| + | || | ||
| + | |- | ||
| + | || | ||
| + | || | ||
| + | |- | ||
| + | || | ||
| + | || | ||
| + | |- | ||
| + | || | ||
| + | || | ||
| + | |- | ||
| + | || | ||
| + | || | ||
| + | |} | ||
==Editing Reports== | ==Editing Reports== | ||
Revision as of 21:58, 1 July 2019
Contents
Overview
The SmartSimple reporting system is an integral of our business operating system.
A report allows you to manipulate both the contents and the presentation of the data contained in one or more of the SmartSimple tables; unlike a table, reports present only the data that meets the criteria you define. They also have the ability to aggregate and display summary information.
Reports provide the following features:
- No additional buying or installation of software
- All creation functionality available within the standard interface
- Viewable from any browser
- Accessible via Microsoft Word or Excel with the appropriate SmartSimple plug-in
Benefits of Reports:
- Display data from one or more tables in one place
- Group-aggregate data from one or more table
- Display the grouped data in a variety of different types of graphs
- Export the data into any file format that you wish OR
- Designate Internet-enabling so that the reports can be linked to public websites
- Group reports together as tabs, allowing similar topic-based reports to be found together
- Copy and modify built-in reports as the basis of your customized reports
User Role-based security defines who can view the reports that you create from your system.
You must be a user with SysAdmin privileges in order to create reports from your SmartSimple system.
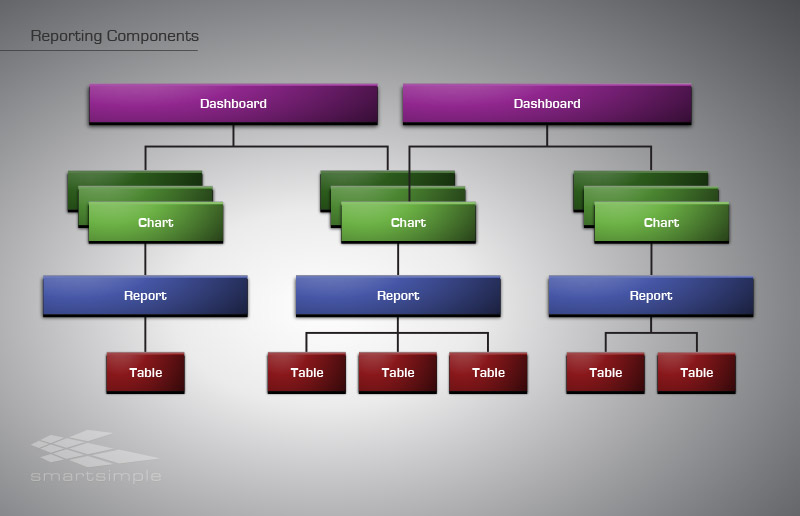
Report Components
You will encounter three major components in the reporting system:
- Reports that are created from underlying SmartSimple database tables - you can connect the required tables to generate a report
- Graphs that you create yourself. These are based on existing reports and are used to display the report in a graphic format.
- Dashboards that will display multiple charts on a single page
The following diagram shows the relationship between these three types of entities:
Charts
Charts are used to display the information from a report in an easy-to-read “graphic” format.
- You can create pie charts, bar charts, line charts, and table-type charts.
- You can create more than one chart type of each report and when displaying a report, choose from any of the charts associated with the report.
- Generally, you will choose a “summary” type report as the basis for the chart, as that type of information is more meaningful when displayed in this manner.
A user can only access the chart if they have permission to see the report the chart is based on.
Dashboards
A dashboard is a single page view of a set of charts.
- When the user displays the dashboard, each report referenced by each chart is processed, and the current data is displayed in charts that are displayed on the dashboard.
- You can create multiple dashboards to show different sets of key indicators.
- A user can indicate that a specific dashboard should be their home page within SmartSimple, giving them an immediate view of key information from the system when they first log in.
- Each dashboard needs to be permissioned to the roles you wish to be able to see the dashboard.
Tables
In order to make the creation of reports a little simpler, some of the SmartSimple tables are presented in a denormalized format when using the Report Builder.
For example, the contact record does not contain the company name; these two tables are linked at the database level through the CompanyID field. So contact table does not contain the company name field but rather a key field that links to the company table.
But when you use the contact table within the Report Builder it will display a field Company Name. This means that you can use this field without needing to link the two tables together.
Configuration - Essentials
Permissioning Reports
Access to the report-creation features is controlled by the role-based manager permission. So you must be in a role associated with this feature in order to create reports.
Users who will only view reports do not need these manager permissions.
You must be a member of a role with manager permission for Reports if you wish to do any of the following actions:
- Create new reports.
- Edit or copy existing reports.
- Delete existing reports, either individual or as batch deletes.
To permission which roles will have the ability to create, edit, and delete reports in your system, follow these steps:
1. Click on the 9-square menu icon on the top right of your page.

2. Under the heading Configuration, select Roles and Security.

3. Under the subheading System Security Settings, select the hyperlink System Feature Permissions.
4. Click into the tab labelled Action Permission.

5. Scroll down until you see the field labelled Reports - Manager. Click into the text box in order to select from a drop-down of user roles that will have manager permissions for reports.
-
-
- You can also specifically permission which roles will have the ability to 'Export 'Data from reports.

6. Click Save at the bottom of the screen when you are done.
Accessing Reports
A user who is permissioned for report use can access the reports available to them. Follow these steps to access reports in your SmartSimple system:
1. Click the 9-square menu icon on the top right of your page.
2. Under the heading Tools, select Reports.

The list view of available system reports will be displayed.

The report window consists of the following sections along the top row of tabs:
- Reports: This displays a list of your system's current reports that have been made available to you.
- Global Report Template: This tab is used to define a customized HTML template for all reports.
- Dashboards:
- Web Access Statistics: This tab displays statistics on how often your web-enabled reports have been accessed.
- Deleted Reports: This tab displays a list of any deleted reports in your system.
You can filter the results of your report list by choosing a Category of reports - this can be found at the top right of your page. Clicking into the Category field will allow a drop-down list of available report categories to appear:

You can also search through reports manually by using the Search bar on the top right, just above the list view. If your results exceed the maximum amount of records displayed on a page, toggle between different pages by selecting the next or back arrow icons on the top right. The count of records that you are viewing out of the total will always be displayed next to these buttons.
Any reports that have been Internet-enabled will have a black dot under the Internet Enabled column to indicate so.
Report List Columns
Each report on the main list of reports will have buttons to the left of it that have several different functions. The functions are described in the table below:
The columns on the list view of reports are described in the following table: