Difference between revisions of "Reports"
| Line 1: | Line 1: | ||
{{Banner-UnderConstruction}} | {{Banner-UnderConstruction}} | ||
| + | |||
=Overview= | =Overview= | ||
| − | The [[SmartSimple]] reporting system is an integral of our business operating system. Reports provide the following features: | + | The [[SmartSimple]] reporting system is an integral of our business operating system. |
| + | |||
| + | A report allows you to manipulate both the contents and the presentation of the data contained in one or more of the SmartSimple tables; unlike a table, reports present only the data that meets the criteria you define. They also have the ability to aggregate and display summary information. | ||
| + | |||
| + | Reports provide the following features: | ||
* No additional buying or installation of software | * No additional buying or installation of software | ||
| Line 18: | Line 23: | ||
* Designate [[Internet Enabled Reports|Internet-enabling]] so that the reports can be linked to public websites | * Designate [[Internet Enabled Reports|Internet-enabling]] so that the reports can be linked to public websites | ||
* Group reports together as '''tabs''', allowing similar topic-based reports to be found together | * Group reports together as '''tabs''', allowing similar topic-based reports to be found together | ||
| − | * | + | * Copy and modify built-in reports as the basis of your customized reports |
[[User Role]]-based [[Role-Based Security|security]] defines who can view the reports that you create from your system. | [[User Role]]-based [[Role-Based Security|security]] defines who can view the reports that you create from your system. | ||
| Line 33: | Line 38: | ||
:: [[Image:Reporting-componets-800w (2).jpg|link=]] | :: [[Image:Reporting-componets-800w (2).jpg|link=]] | ||
| + | ===Charts=== | ||
| + | Charts are used to display the information from a report in an easy-to-read “graphic” format. | ||
| + | |||
| + | * You can create pie charts, bar charts, line charts, and table-type charts. | ||
| + | * You can create more than one chart type of each report and when displaying a report, choose from any of the charts associated with the report. | ||
| + | * Generally, you will choose a “summary” type report as the basis for the chart, as that type of information is more meaningful when displayed in this manner. | ||
| + | |||
| + | A [wiki/User user] can only access the chart if they have permission to see the report the chart is based on. | ||
| + | |||
| + | ===Dashboards=== | ||
| + | A dashboard is a single page view of a set of charts. | ||
| + | |||
| + | * When the [wiki/User user] displays the dashboard, each report referenced by each chart is processed, and the current data is displayed in charts that are displayed on the dashboard. | ||
| + | * You can create multiple dashboards to show different sets of key indicators. | ||
| + | * A [wiki/User user] can indicate that a specific dashboard should be their “home page” within [wiki/SmartSimple SmartSimple], giving them an immediate view of key information from the system when they first log in. | ||
| + | * Each dashboard needs to be permissioned to the [wiki/Role roles] you wish to be able to see the dashboard. | ||
| + | |||
=Configuration - Essentials= | =Configuration - Essentials= | ||
==Accessing Reports== | ==Accessing Reports== | ||
Revision as of 17:42, 30 June 2019
Contents
Overview
The SmartSimple reporting system is an integral of our business operating system.
A report allows you to manipulate both the contents and the presentation of the data contained in one or more of the SmartSimple tables; unlike a table, reports present only the data that meets the criteria you define. They also have the ability to aggregate and display summary information.
Reports provide the following features:
- No additional buying or installation of software
- All creation functionality available within the standard interface
- Viewable from any browser
- Accessible via Microsoft Word or Excel with the appropriate SmartSimple plug-in
Benefits of Reports:
- Display data from one or more tables in one place
- Group-aggregate data from one or more table
- Display the grouped data in a variety of different types of graphs
- Export the data into any file format that you wish OR
- Designate Internet-enabling so that the reports can be linked to public websites
- Group reports together as tabs, allowing similar topic-based reports to be found together
- Copy and modify built-in reports as the basis of your customized reports
User Role-based security defines who can view the reports that you create from your system.
You must be a user with SysAdmin privileges in order to create reports from your SmartSimple system.
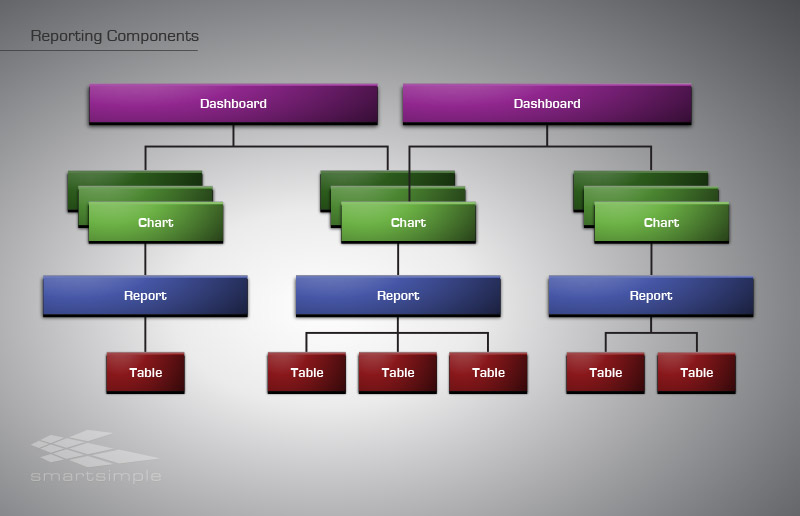
Report Components
You will encounter three major components in the reporting system:
- Reports that are created from underlying SmartSimple database tables - you can connect the required tables to generate a report
- Graphs that you create yourself. These are based on existing reports and are used to display the report in a graphic format.
- Dashboards that will display multiple charts on a single page
The following diagram shows the relationship between these three types of entities:
Charts
Charts are used to display the information from a report in an easy-to-read “graphic” format.
- You can create pie charts, bar charts, line charts, and table-type charts.
- You can create more than one chart type of each report and when displaying a report, choose from any of the charts associated with the report.
- Generally, you will choose a “summary” type report as the basis for the chart, as that type of information is more meaningful when displayed in this manner.
A [wiki/User user] can only access the chart if they have permission to see the report the chart is based on.
Dashboards
A dashboard is a single page view of a set of charts.
- When the [wiki/User user] displays the dashboard, each report referenced by each chart is processed, and the current data is displayed in charts that are displayed on the dashboard.
- You can create multiple dashboards to show different sets of key indicators.
- A [wiki/User user] can indicate that a specific dashboard should be their “home page” within [wiki/SmartSimple SmartSimple], giving them an immediate view of key information from the system when they first log in.
- Each dashboard needs to be permissioned to the [wiki/Role roles] you wish to be able to see the dashboard.
Configuration - Essentials
Accessing Reports
A user who is permissioned for report use can access the reports available to them. Follow these steps to access reports in your SmartSimple system:
1. Click the 9-square menu icon on the top right of your page.

2. Under the heading Tools, select Reports.

The list view of available system reports will be displayed.