Creating a Dashboard to Display a Set of Charts
A dashboard provides the user with a graphic view of a set of charts.
1. Click the Communications, Reports menu.
2. Click the Dashboard tab.
Currently there are no dashboards defined.
3. Click the New Dashboards tab.
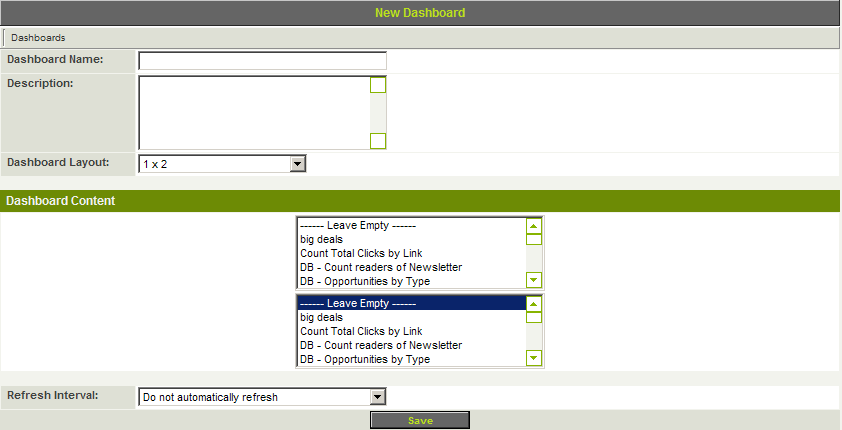
The New Dashboard window is displayed.
Each dashboard has the following properties:
- Dashboard Name - Narrative name of the dashboard.
- Description - Dashboard description.
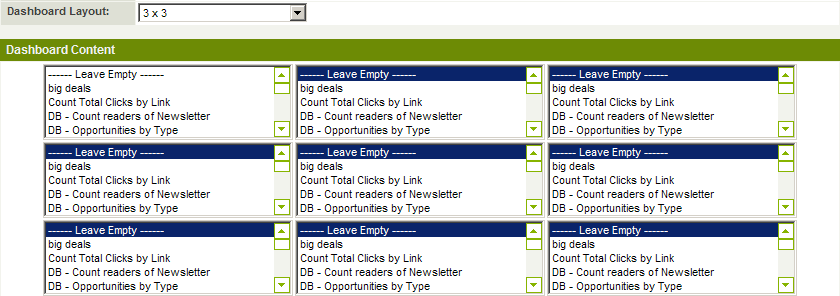
- Dashboard Layout - Determines the orientation and number of charts to be included in the dashboards. Options are one column: 1 * 1 (2, 3, 4, 5 or 6), two columns: 2 * 2, 3 and three columns: 3 * 3. Changing the orientation will change the Dashboard content area of the page and the number of charts that can be selected.
- Refresh Interval - Determines how frequently a dashboard should be refreshed when displayed. Both built-in and custom charts will be displayed in the chart list, provided you have previously permissioned these reports for a role.
4. Experiment with different dashboard layouts.
5. Change the Layout to 1 * 3.
6. Set the dashboard name to System Activity.
7. Set the description as shown below:
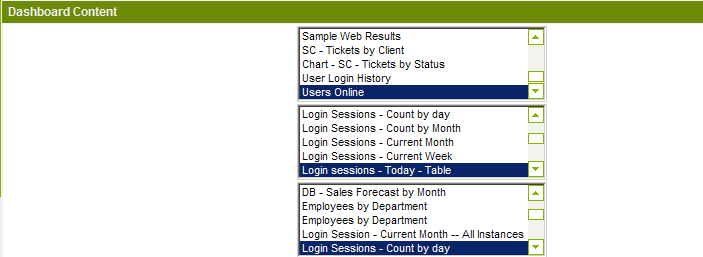
8. Set the chart as shown below:
You will only be able to select a chart if you have permission to see the associated report.
9. Click the Save button.
10. Click the Preview button.
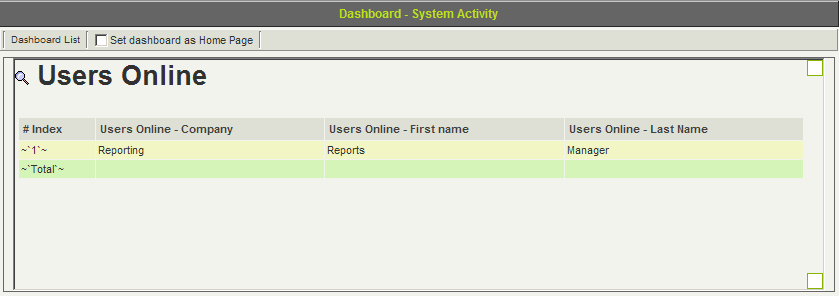
The dashboard is displayed.
Set a Dashboard as a Home Page
You can specify any dashboard to be your home page. The home page is the first page that is displayed when you log into the system.
1. Click the Set dashboard as Home Page check box.
There is no save required to effect this change.


