Creating an Organization Chart and Company Hierarchy
When you have a large and complex selling situation you can create:
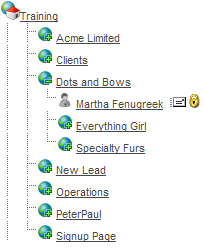
- A hierarchy that shows the relationships that exist between the companies – subsidiaries, etc.
The major benefit of a company hierarchy is that you can review business opportunities at the subsidiary level, but also at the main company level showing you the overall value of the company.
- An organization chart that shows the contact reporting relationships.
The major benefit of an organization chart is that you can get a better understanding of the decision-making process and who you need to be selling to.
Steps to Create a Company Hierarchy
To create a company hierarchy, use the following steps:
1. Click the My Companies tab.
2. Select the Subsidiary company.
3. Click the Edit Company button.
4. Use the Lookup button to set the Parent Company to the main company.
5. Click the Save button.
6. Click the Organization, External People menu.
The company is now displayed as a subsidiary of the main company.
Steps to Create an Organization Chart
The organization chart that you create can reference people across multiple companies. For example, the general manager of a division of a company would report to someone in head office.
1. Click the My Contacts tab.
2. Click the All button.
All your contacts are displayed.
3. Click on any contact.
The contact details are displayed.
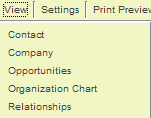
4. Click the Edit tab, followed by View, Organization Chart.
The Organization Details are displayed.
5. Click the Edit icon.
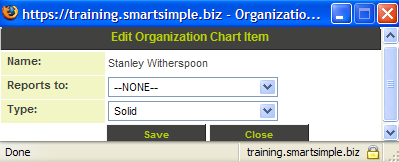
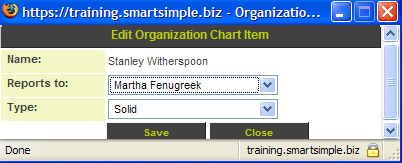
The Edit Organization Chart Item window is displayed.
- You can choose any person from any company from the Report to combo box.
- You can also choose to show a solid line or a dotted line reporting relationship.
6. Set their supervisor.
7. Click the Save button.
The reporting relationship is established.
8. Click the View Map icon.
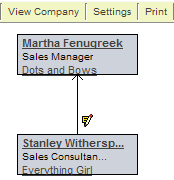
The organization chart is displayed.
You can:
- Click the Edit link in the reporting chart to change the reporting relationship.
- Click the contact’s name to display the contact details.
- Click the company name to see the company details.
- Click the Print button to print the Organization chart.
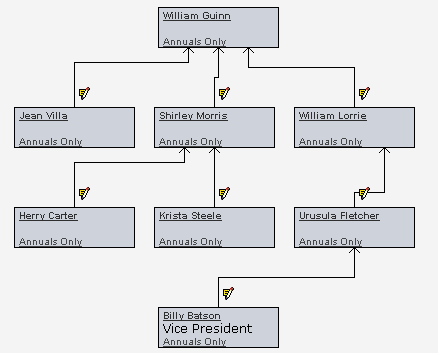
This example is as simple as an organization chart could be. A more realistic example is shown below.
