Difference between revisions of "Creating Organisation Charts"
Julia Decker (talk | contribs) |
|||
| (2 intermediate revisions by one other user not shown) | |||
| Line 1: | Line 1: | ||
| + | {{Deprecated}} | ||
| + | |||
An organisational chart is a chart which represents the structure of an organisation in terms of position. The chart shows the relationship between managers and staff who make up an organisation. The chart also shows relationships between staff in the organisation, which can be: | An organisational chart is a chart which represents the structure of an organisation in terms of position. The chart shows the relationship between managers and staff who make up an organisation. The chart also shows relationships between staff in the organisation, which can be: | ||
| + | |||
* '''Line''' - direct relationship between superior and subordinate. | * '''Line''' - direct relationship between superior and subordinate. | ||
* '''Lateral''' - relationship between different departments on the same hierarchical level. | * '''Lateral''' - relationship between different departments on the same hierarchical level. | ||
| Line 5: | Line 8: | ||
There are several general limitations with organisational charts: | There are several general limitations with organisational charts: | ||
| − | * It only shows 'formal relationships' and tells nothing of the pattern of human (social) relationships which develop. | + | |
| + | * It only shows 'formal relationships' and tells nothing of the pattern of human (social) relationships which develop. If you need to manage social types of relationships within the system you should use the '''People Relationship''' feature. | ||
* It very quickly becomes out-of-date, especially in large organisations which change their staff regularly. | * It very quickly becomes out-of-date, especially in large organisations which change their staff regularly. | ||
Once you have established organisation charts within the system you can display their details easily by clicking the '''Organisation Chart''' Icon displayed on the contact and company page. | Once you have established organisation charts within the system you can display their details easily by clicking the '''Organisation Chart''' Icon displayed on the contact and company page. | ||
| − | + | ||
[[Image:Contact.png]] | [[Image:Contact.png]] | ||
| Line 16: | Line 20: | ||
[[Image:Contact2.png]] | [[Image:Contact2.png]] | ||
| − | + | ||
All the users are displayed in the [[Hierarchy|hierarchy]] of operational areas. | All the users are displayed in the [[Hierarchy|hierarchy]] of operational areas. | ||
| Line 22: | Line 26: | ||
[[Image:Contact3.png]] | [[Image:Contact3.png]] | ||
| − | + | ||
3. Choose the '''View''', '''Organisation Chart''' [[Menu|menu]]. | 3. Choose the '''View''', '''Organisation Chart''' [[Menu|menu]]. | ||
| Line 28: | Line 32: | ||
[[Image:Contact4.png]] | [[Image:Contact4.png]] | ||
| − | + | ||
Once you have established the organisation chart, clicking the '''View Organisation chart''' [[Menu|menu]] will display the completed chart. | Once you have established the organisation chart, clicking the '''View Organisation chart''' [[Menu|menu]] will display the completed chart. | ||
| Line 34: | Line 38: | ||
[[Image:Contact5.png]] | [[Image:Contact5.png]] | ||
| − | + | ||
Each [[User|user]] in this section of the hierarchy is displayed. | Each [[User|user]] in this section of the hierarchy is displayed. | ||
| − | The organisation chart is created from the “bottom up”. | + | The organisation chart is created from the “bottom up”. You specify who reports to whom, rather than who is in the chart and who reports to them. In this instance you will have everyone in this department report to Brendan Fetcher. |
5. Click the '''Edit''' button for Thomas Muir. | 5. Click the '''Edit''' button for Thomas Muir. | ||
| Line 44: | Line 48: | ||
[[Image:Contact6.png]] | [[Image:Contact6.png]] | ||
| − | + | ||
* The selected [[User|user’s]] name is displayed at the top of the window. | * The selected [[User|user’s]] name is displayed at the top of the window. | ||
| − | * The '''Reports to''' will list all contacts. | + | * The '''Reports to''' will list all contacts. The contacts in the current organisation department are displayed first. |
* The '''Type''' combo box contains two options – a solid line to indicate a direct reporting relationship and a dotted line to indicate an indirect reporting relationship. | * The '''Type''' combo box contains two options – a solid line to indicate a direct reporting relationship and a dotted line to indicate an indirect reporting relationship. | ||
| Line 52: | Line 56: | ||
[[Image:Contact7.png]] | [[Image:Contact7.png]] | ||
| − | + | ||
7. Choose '''Brendan Fetcher'''. | 7. Choose '''Brendan Fetcher'''. | ||
| Line 60: | Line 64: | ||
[[Image:Contact8.png]] | [[Image:Contact8.png]] | ||
| − | + | ||
9. Repeat this process for all the other [[User|users]] – except Brendan Fetcher. | 9. Repeat this process for all the other [[User|users]] – except Brendan Fetcher. | ||
| Line 66: | Line 70: | ||
==Viewing an Organisation Chart== | ==Viewing an Organisation Chart== | ||
| − | |||
1. Click the '''View Map''' button. | 1. Click the '''View Map''' button. | ||
| Line 72: | Line 75: | ||
[[Image:Contact10.png]] | [[Image:Contact10.png]] | ||
| − | + | ||
There are a number of active links in the organisation chart. | There are a number of active links in the organisation chart. | ||
| + | |||
* Clicking on any contact name will display the contact details. | * Clicking on any contact name will display the contact details. | ||
* Clicking on any contact company name will display the contact company details. | * Clicking on any contact company name will display the contact company details. | ||
| Line 84: | Line 88: | ||
[[Image:Contact11.png]] | [[Image:Contact11.png]] | ||
| − | + | ||
3. Click on the '''Organisation Chart''' icon. | 3. Click on the '''Organisation Chart''' icon. | ||
[[Image:contact.png]] | [[Image:contact.png]] | ||
| − | + | ||
The organisation chart is redisplayed. | The organisation chart is redisplayed. | ||
==Creating a Multiple Branch Organisation Chart== | ==Creating a Multiple Branch Organisation Chart== | ||
| − | |||
Next you will set up the organisation chart for the executive branch and establish the reporting relationship between sales and executive. | Next you will set up the organisation chart for the executive branch and establish the reporting relationship between sales and executive. | ||
| Line 98: | Line 101: | ||
[[Image:Conatct12.png]] | [[Image:Conatct12.png]] | ||
| − | + | ||
The chart will look as follows: | The chart will look as follows: | ||
[[Image:Contact13.png]] | [[Image:Contact13.png]] | ||
| − | + | ||
2. Create a reporting relationship between Victoria Walters and Brendan Fetcher. | 2. Create a reporting relationship between Victoria Walters and Brendan Fetcher. | ||
[[Image:Contact14.png]] | [[Image:Contact14.png]] | ||
| − | + | ||
3. View the '''Organisation Chart''' for '''Sales'''. | 3. View the '''Organisation Chart''' for '''Sales'''. | ||
[[Image:Contact15.png]] | [[Image:Contact15.png]] | ||
| − | + | ||
Only the sales branch is displayed with the reporting relationship to the executive branch displayed. | Only the sales branch is displayed with the reporting relationship to the executive branch displayed. | ||
| Line 122: | Line 125: | ||
| − | [[Category:System Management]] | + | [[Category:System Management]][[Category:Organizations]] |
Latest revision as of 10:44, 6 June 2019
An organisational chart is a chart which represents the structure of an organisation in terms of position. The chart shows the relationship between managers and staff who make up an organisation. The chart also shows relationships between staff in the organisation, which can be:
- Line - direct relationship between superior and subordinate.
- Lateral - relationship between different departments on the same hierarchical level.
- Staff - relationship between a managerial assistant and other areas. The assistant will be able to offer advice to a line manager. However, they have no authority over the line manager actions.
There are several general limitations with organisational charts:
- It only shows 'formal relationships' and tells nothing of the pattern of human (social) relationships which develop. If you need to manage social types of relationships within the system you should use the People Relationship feature.
- It very quickly becomes out-of-date, especially in large organisations which change their staff regularly.
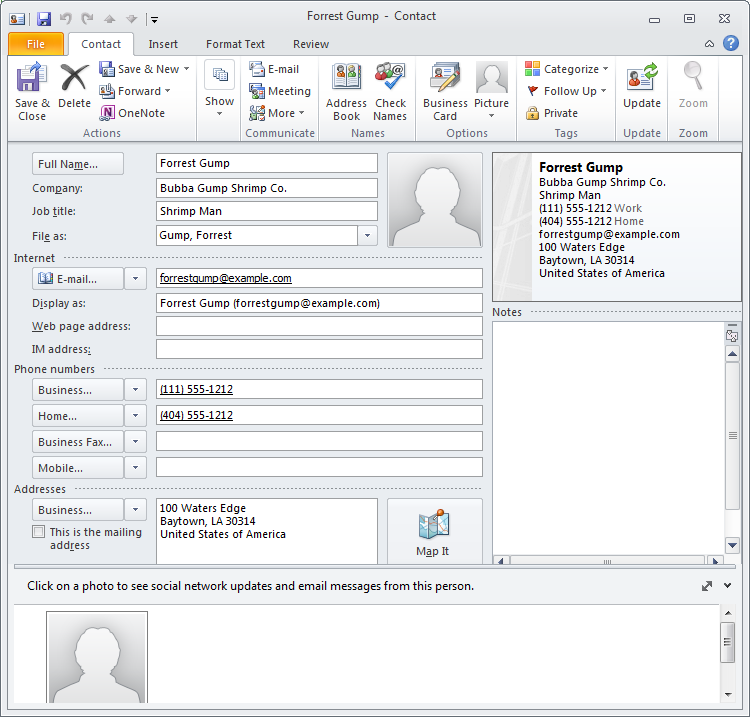
Once you have established organisation charts within the system you can display their details easily by clicking the Organisation Chart Icon displayed on the contact and company page.
In this exercise you will create an organisation chart for the users you previously imported.
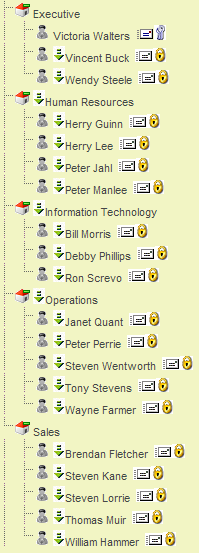
1. Choose the Organisation, Internal Users menu.
All the users are displayed in the hierarchy of operational areas.
2. Click the Sales branch.
3. Choose the View, Organisation Chart menu.
The blank organisation chart is displayed for the sales branch.
Once you have established the organisation chart, clicking the View Organisation chart menu will display the completed chart.
4. Click the Settings tab.
Each user in this section of the hierarchy is displayed.
The organisation chart is created from the “bottom up”. You specify who reports to whom, rather than who is in the chart and who reports to them. In this instance you will have everyone in this department report to Brendan Fetcher.
5. Click the Edit button for Thomas Muir.
The Edit Organisation Chart Item window is displayed.
- The selected user’s name is displayed at the top of the window.
- The Reports to will list all contacts. The contacts in the current organisation department are displayed first.
- The Type combo box contains two options – a solid line to indicate a direct reporting relationship and a dotted line to indicate an indirect reporting relationship.
6. Click in the Reports to combo box.
7. Choose Brendan Fetcher.
8. Click the Save button.
The reporting relationship is displayed.
9. Repeat this process for all the other users – except Brendan Fetcher.
Viewing an Organisation Chart
1. Click the View Map button.
The organisation chart is displayed.
There are a number of active links in the organisation chart.
- Clicking on any contact name will display the contact details.
- Clicking on any contact company name will display the contact company details.
- Clicking on the edit icon next to the relationship line will display the edit window.
- The Print tab at the top of the page is used to print the organisation chart.
2. Click on Brendan Fetcher’s name.
The contact record is displayed.
3. Click on the Organisation Chart icon.
The organisation chart is redisplayed.
Creating a Multiple Branch Organisation Chart
Next you will set up the organisation chart for the executive branch and establish the reporting relationship between sales and executive.
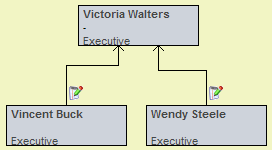
1. Set up the following reporting relationships in the Executive branch.
The chart will look as follows:
2. Create a reporting relationship between Victoria Walters and Brendan Fetcher.
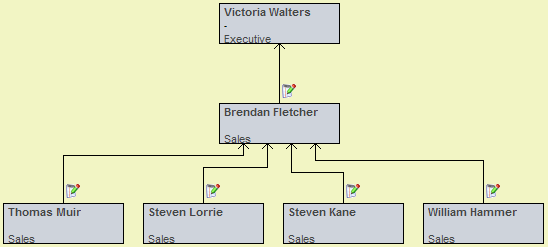
3. View the Organisation Chart for Sales.
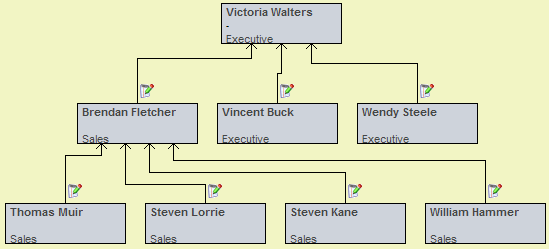
Only the sales branch is displayed with the reporting relationship to the executive branch displayed.
4. Click on the Victoria Walters entry.
5. Click the Organisation Chart icon.
The entire reporting structure is displayed.
