Difference between revisions of "Setting a Chart as a Custom Field"
From SmartWiki
Julia Decker (talk | contribs) |
|||
| (2 intermediate revisions by 2 users not shown) | |||
| Line 1: | Line 1: | ||
| + | {{SeqReportPageHeader}} | ||
| + | |||
You can also associate a chart to a [[Custom Fields|custom field]]. | You can also associate a chart to a [[Custom Fields|custom field]]. | ||
| Line 22: | Line 24: | ||
The chart is then displayed with the correct data. | The chart is then displayed with the correct data. | ||
| − | [[ | + | {{PrevNextStart}} [[Adding a Chart to the Pin Board]] |
| + | {{PrevNextMid}} [[Creating a Dashboard to Display a Set of Charts]] | ||
| + | {{PrevNextEnd}} | ||
| + | |||
| + | [[Category:Reports]][[Category:Custom Fields]] | ||
Latest revision as of 14:43, 26 April 2013

You can also associate a chart to a custom field.
This is a useful technique if you wish to show the sales history for each company in a chart format when you click the company details.
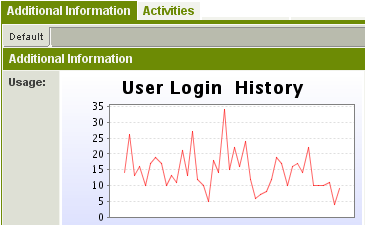
In the example below the login history of each user is displayed when you click the user details.
In order to create a chart that can function as a custom field you use the following steps:
- Create the Report – the report will need to use the @userid@ or the @companyid@, otherwise the same chart will be displayed regardless of the user or company that you select.
- Create the Chart – the chart can be of any type.
- Create the Custom Field – the field type must be Display Only - Text.
- Paste the Chart URL into the Text/Link property of the Custom Field.
- Save the custom field.
When the user or company is displayed the report is processed, and the userID or CompanyID of the current record is passed as a parameter to the report.
The chart is then displayed with the correct data.

