Creating Summary Reports
All the reports that you have created so far have displayed each record from the table that matched the criteria.
In many instances, you will not wish to display individual records, but instead summarize the records and display a total of some numeric value, or perhaps a count of the records.
1. Create a new report named Employees by Department based on the user table.
2. Add Users – Company Name and Users – Last name fields.
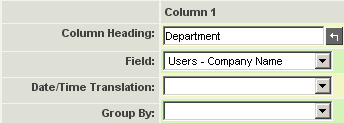
3. Set the Column Headings as shown below:
4. Build, save, and preview the report.
The report displays the department and the employee last name.
5. Close the report and display the Report Builder.
Using Group By
You use the Group By row to specify the type of totaling that you require for each column.
The options available in this combo box are as follows:
- Group By - Groups the selected records by that column. You will usually use this option in addition to one of the other options applied to other fields.
- Sum - Total of a numeric field.
- Min - The smallest value in a field.
- Max - The largest value in a field.
- Count - A count of the number of occurrences.
- Count Distinct - Count the number of distinct occurrences.
- Average - The average of a numeric field.
Using the Count Option
1. Set the following Totals options:
The records will be grouped by department, with the count of employees in each department displayed in the second column.
2. Build, save, and preview the report.
Sorting Totals
You can also apply sorting options to the report.
1. Modify the report to display the number of employees in descending order.
The report will look as follows.
Using Sum
Next you will copy the existing report and display the total salary for each department.
1. Copy the report Employees by Department to a new report Employees Total Salaries.
2. Modify the report as shown below:
- The Salary field has been added to the report and renamed – Salary.
- The Group By Sum function is used to sum the salary for each department.
- The report will sort descending from the department with the highest total salary.
3. Build, save, and preview the report.
Using Average
The average function will calculate the average for each group.
1. Modify the Salary field to the report and add the Average function.
2. Build, save, and preview the report.
You can use the same field multiple times. For example, if you wished to show the total salary AND the average salary in two columns.


