Difference between revisions of "Configuring Interactive List View Charts"
From SmartWiki
Mark Bridger (talk | contribs) (Created page with "==Configuring Interactive List View Charts== Visualize your data with interactive charts. Chart by Status,Type or a value of your choice. Toggle between the chart view and th...") |
Mark Bridger (talk | contribs) |
||
| Line 4: | Line 4: | ||
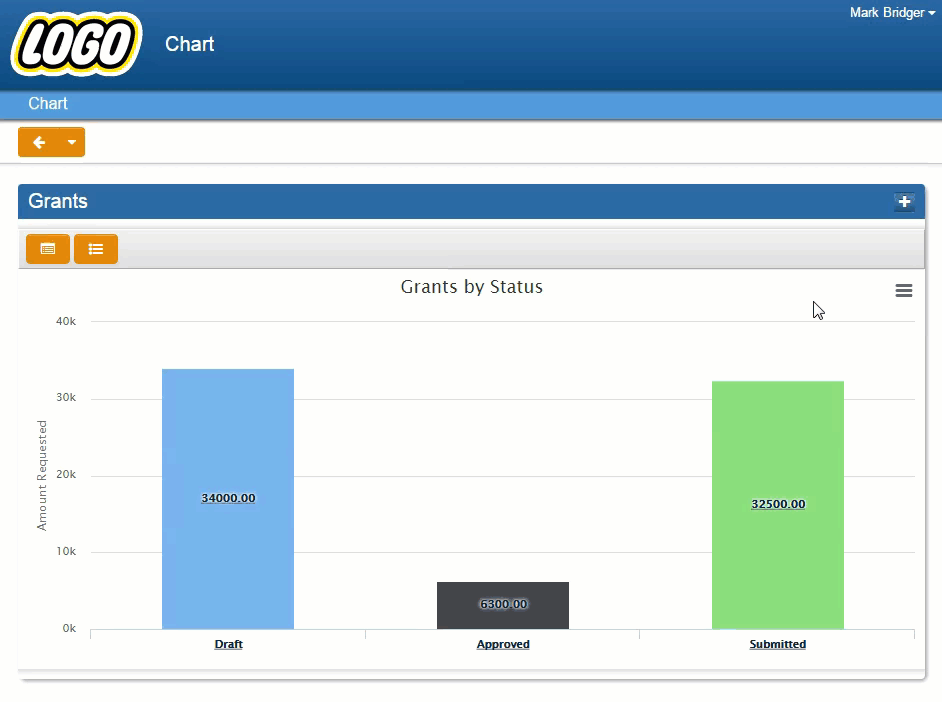
This feature is available in Arcadia X, it only takes a fewseconds to setup and you don’t need to create a report. | This feature is available in Arcadia X, it only takes a fewseconds to setup and you don’t need to create a report. | ||
| + | [[Image:Interactive List View Charts.gif|600px|link=]] | ||
Revision as of 15:36, 28 July 2016
Configuring Interactive List View Charts
Visualize your data with interactive charts. Chart by Status,Type or a value of your choice. Toggle between the chart view and the table view.Drill into the charts to see the data further delineated. Go directly into theobject from the table view. Print charts or export them in multiple formats.
This feature is available in Arcadia X, it only takes a fewseconds to setup and you don’t need to create a report.