Difference between revisions of "Configuring Interactive List View Charts"
(→How to configure Interactive List View Charts) |
Mark Bridger (talk | contribs) |
||
| Line 55: | Line 55: | ||
| − | 9) Select the Chart Type you wish to | + | 9) Select the Chart Type you wish to use. The current options include: |
* Bar | * Bar | ||
* Horizontal Bar | * Horizontal Bar | ||
| Line 70: | Line 70: | ||
[[Image:ichart-list-view-selectAxis.png|600px|link=]] | [[Image:ichart-list-view-selectAxis.png|600px|link=]] | ||
| − | '''NOTE:''' If the Aggregation Type is Sum or Average then the Y-Axis | + | '''NOTE:''' If the Aggregation Type is Sum or Average then the Y-Axis must be a numeric value. |
11) Select the Aggregation type from the available options ... | 11) Select the Aggregation type from the available options ... | ||
| − | * Sum: provide a sum of all values in the column selected as the Y-Axis for each grouping defined in the column selected in the X-Axis | + | * '''Sum''': provide a sum of all values in the column selected as the Y-Axis for each grouping defined in the column selected in the X-Axis |
| − | * Average: provide an average of all values in the column selected as the Y-Axis for each grouping defined in the column selected in the X-Axis | + | * '''Average''': provide an average of all values in the column selected as the Y-Axis for each grouping defined in the column selected in the X-Axis |
| − | * Count: provide an overall count of records for each grouping defined in the column selected in the X-Axis | + | * '''Count''': provide an overall count of records for each grouping defined in the column selected in the X-Axis |
| − | 12) Select the Default View type. This is how the information will be displayed when the user | + | 12) Select the Default View type. This is how the information will be displayed when the user logs in and accesses the information. The available options are: |
*'''Chart''': will display the chart when user logs in | *'''Chart''': will display the chart when user logs in | ||
Revision as of 09:58, 3 August 2016
Configuring Interactive List View Charts
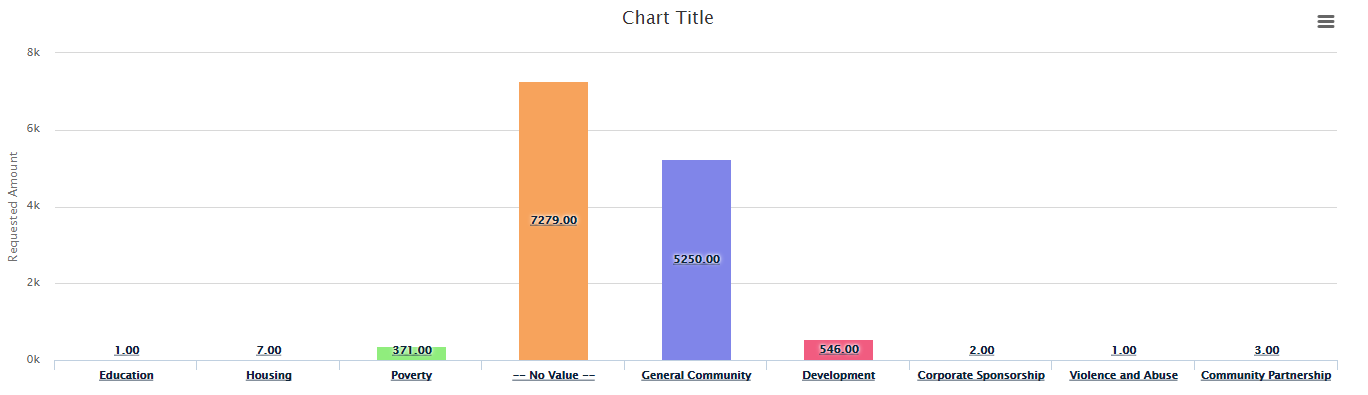
Visualize your data with interactive charts. Chart by Status,Type or a value of your choice. Toggle between the chart view and the table view. Drill into the charts to see the data further delineated. Go directly into the object from the table view. Print charts or export them in multiple formats.
This feature is available in Arcadia X, it only takes a few seconds to setup and you don’t need to create a report.
How to configure Interactive List View Charts
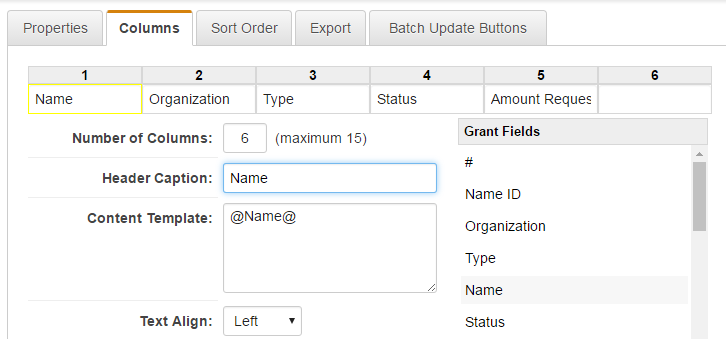
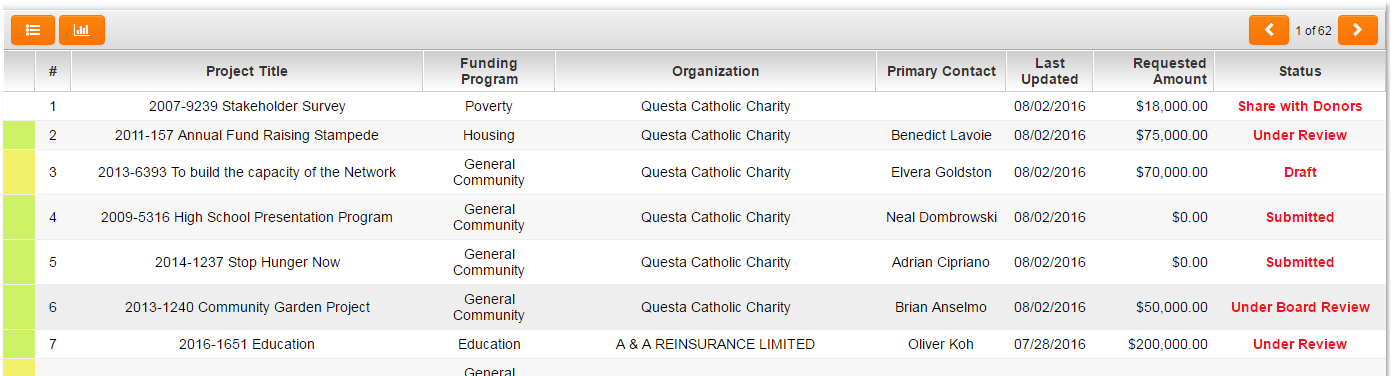
1) If your list view does not already exist then create a list view of the data you want to chart (List view of a UTA level 1 is shown below).
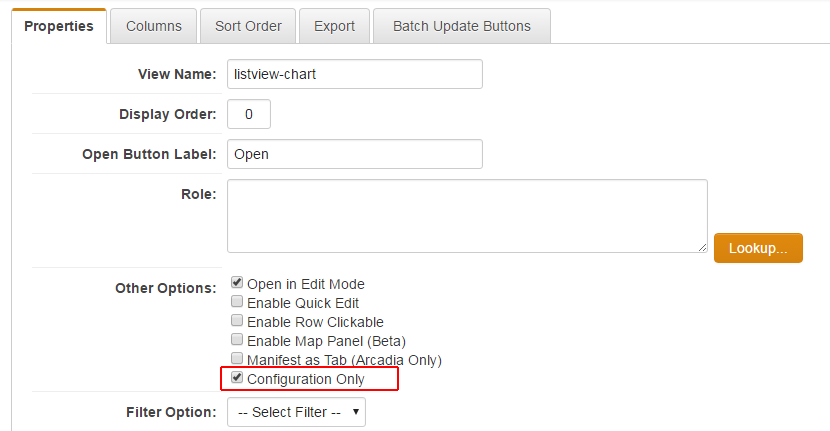
NOTE: If your list view is only going to be used for charts, check Configuration Only. This setting hides this list view from the View list but you can still pick it view when configuring an Arcadia X portal.
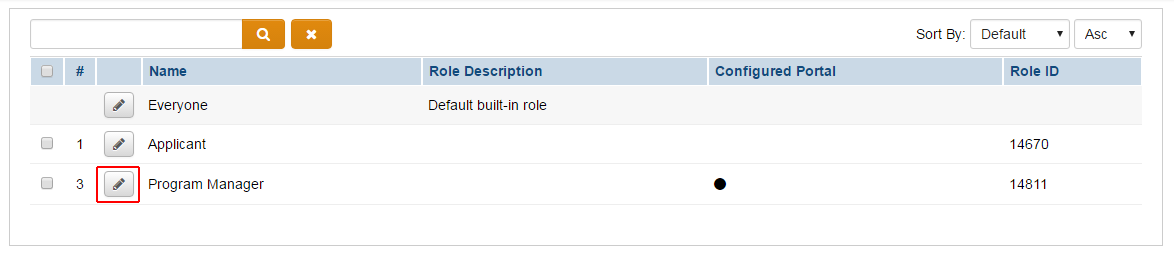
2) Go to Configuration > Roles & Permissions > User Roles
3) Click the Edit button on the desired role with an Arcadia X portal.
4) Create an Action Tab for the chart and choose the Content Type of Sections then Save.
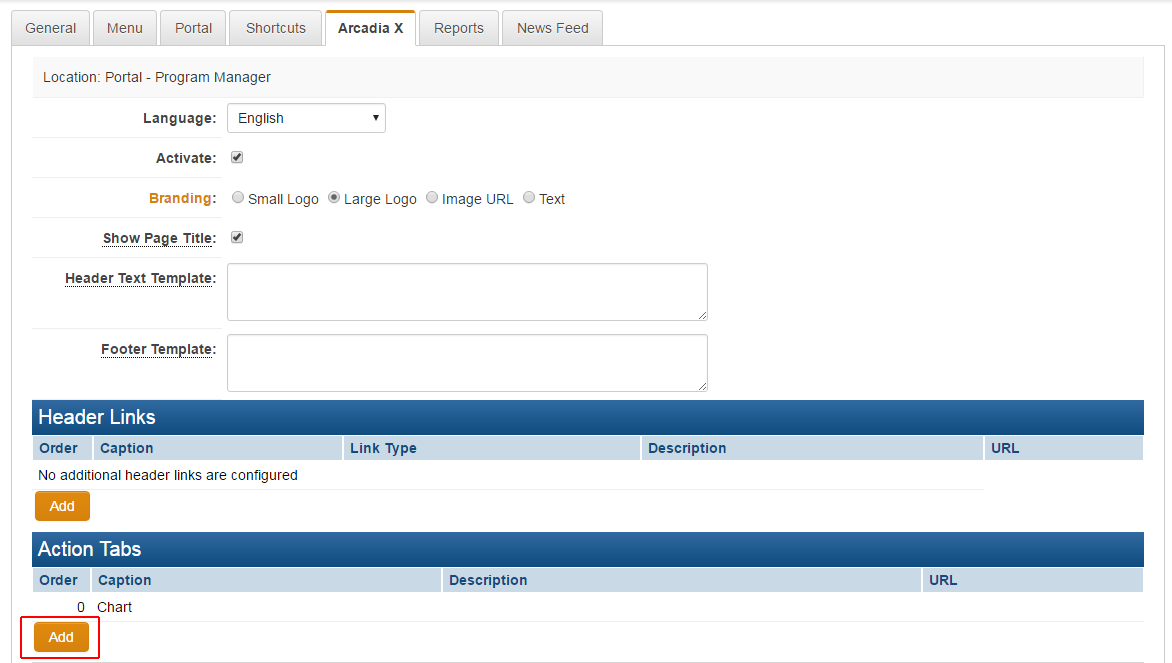
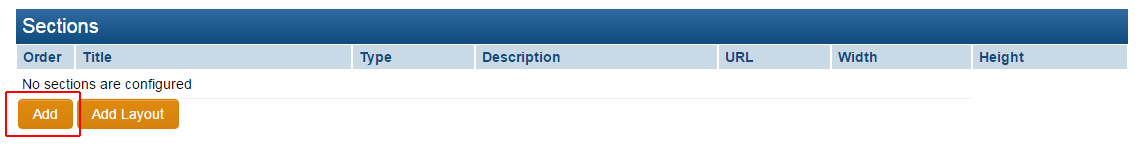
5) Add a Section.
6) Choose the Type of Chart. This will expose additional Chart List View, Chart Type, X-Axis and Y-Axis options, as well as the Aggregation type.
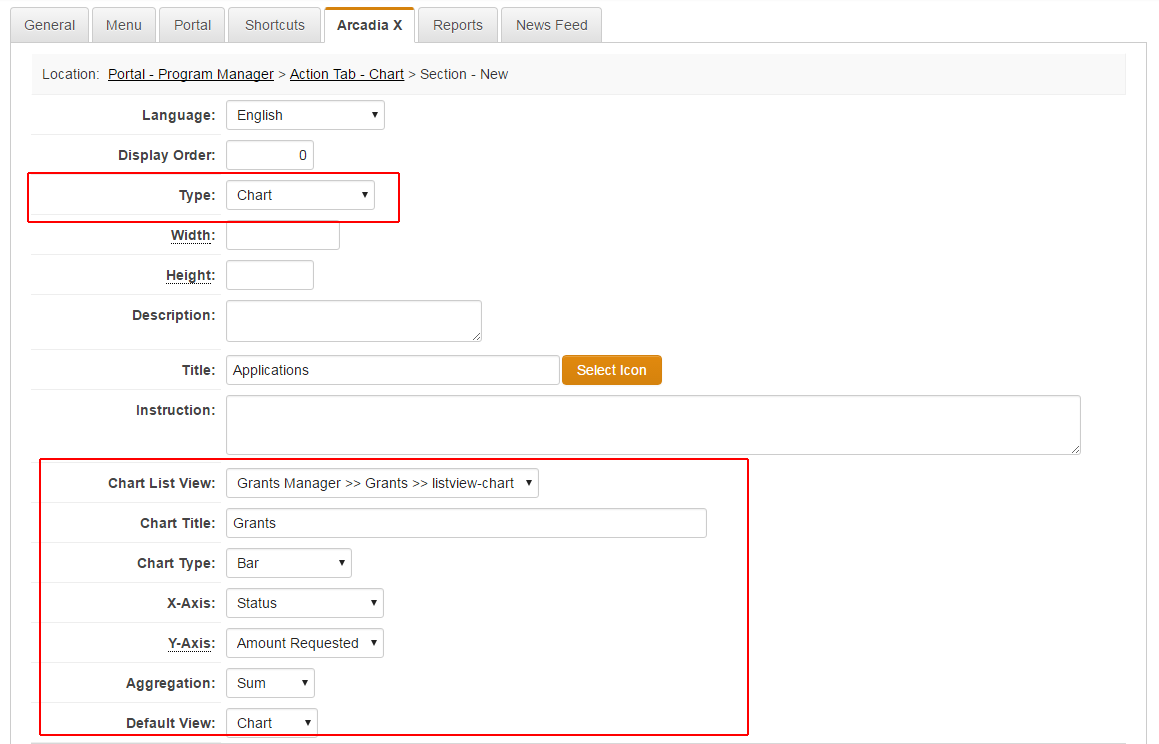
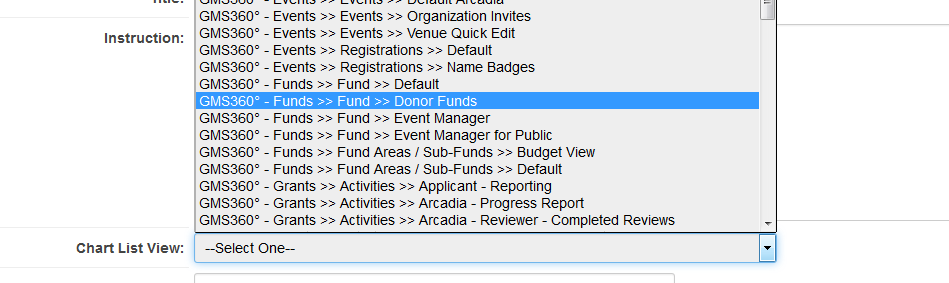
7) Go to the Chart List view section and select the List View you wish to use as the basis for the Chart.
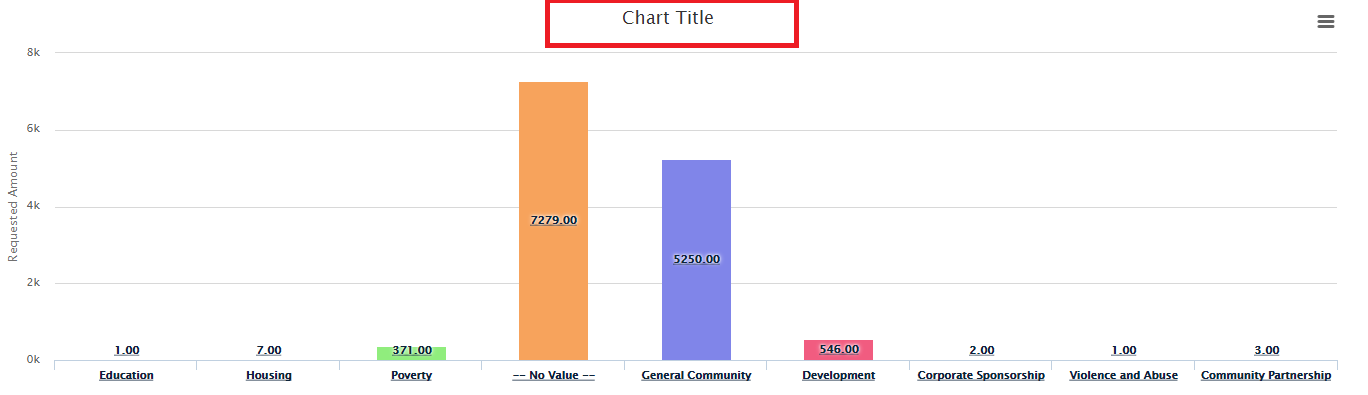
8) Populate the Chart Title if needed.
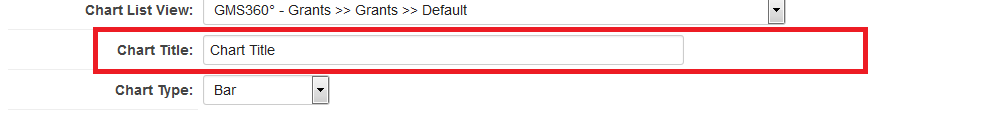
This is the title that will appear on the rendered chart.
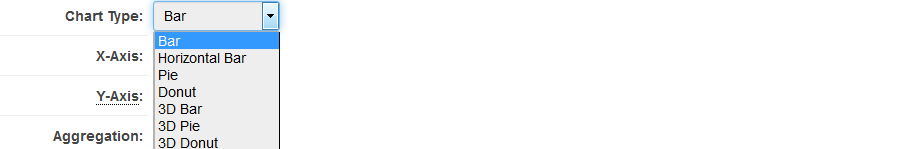
9) Select the Chart Type you wish to use. The current options include:
- Bar
- Horizontal Bar
- Pie
- Donut
- 3D Bar
- 3D Pie
- 3D Donut
10) Select the List View columns that should appear as X-Axis and Y-Axis.
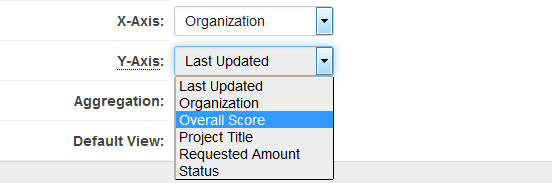
NOTE: If the Aggregation Type is Sum or Average then the Y-Axis must be a numeric value.
11) Select the Aggregation type from the available options ...
- Sum: provide a sum of all values in the column selected as the Y-Axis for each grouping defined in the column selected in the X-Axis
- Average: provide an average of all values in the column selected as the Y-Axis for each grouping defined in the column selected in the X-Axis
- Count: provide an overall count of records for each grouping defined in the column selected in the X-Axis
12) Select the Default View type. This is how the information will be displayed when the user logs in and accesses the information. The available options are:
- Chart: will display the chart when user logs in
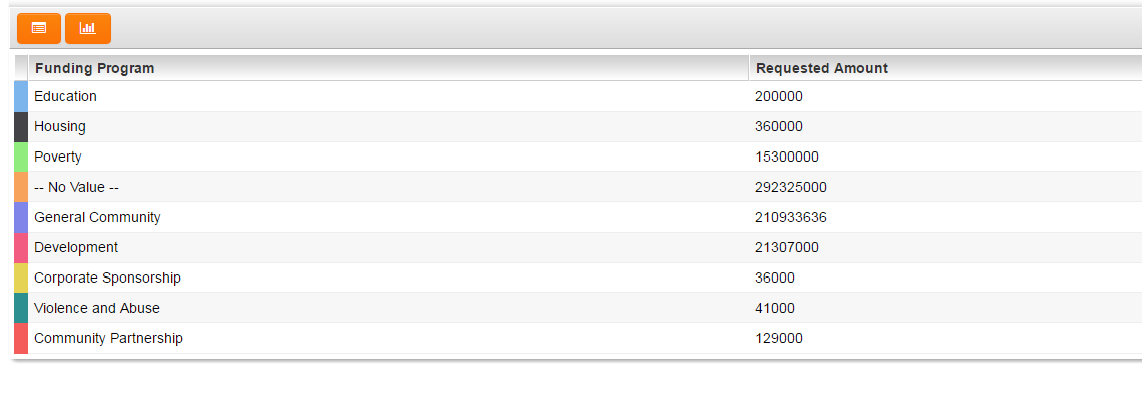
- Table: will display the tabular data when user logs in
- List View: will display the basic list view when user logs in
13) Click Save
14) Preview your Arcadia X section.