Configuring Interactive List View Charts
Configuring Interactive List View Charts
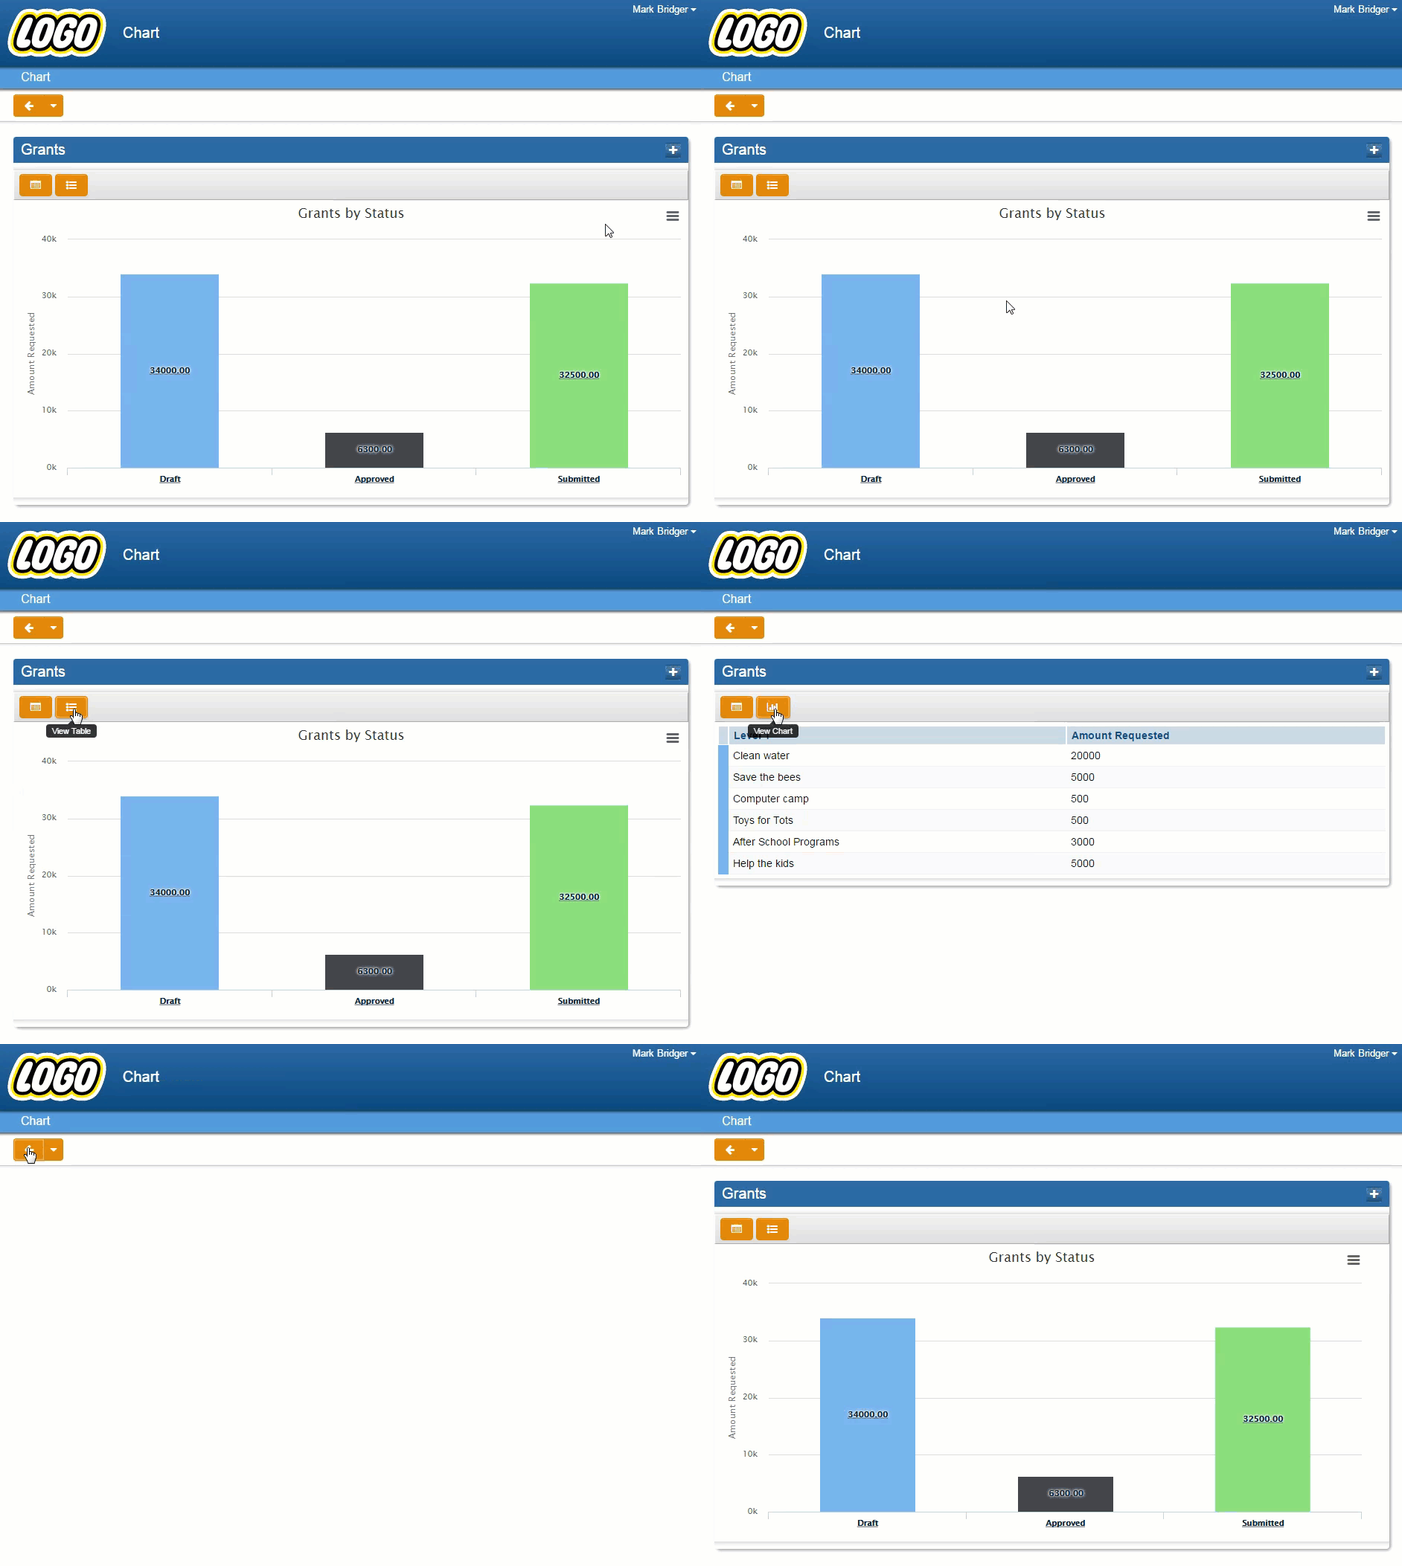
Visualize your data with interactive charts. Chart by Status,Type or a value of your choice. Toggle between the chart view and the table view. Drill into the charts to see the data further delineated. Go directly into the object from the table view. Print charts or export them in multiple formats.
This feature is available in Arcadia X, it only takes a few seconds to setup and you don’t need to create a report.
How to
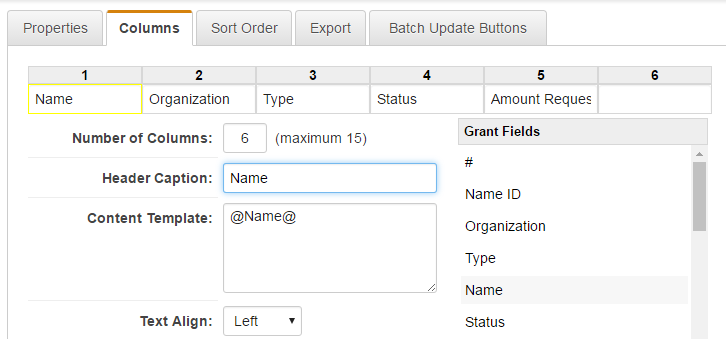
Create a list view of the data you want to chart (List view of a UTA level 1 is shown below).
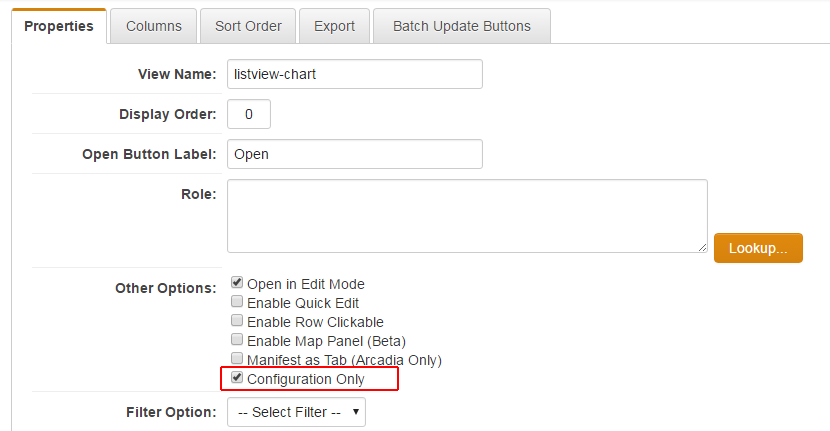
If your list view is only going to be used for charts, check Configuration Only. Note this setting hides this list view from the View list. You can still pick this list view when configuring an Arcadia X portal.
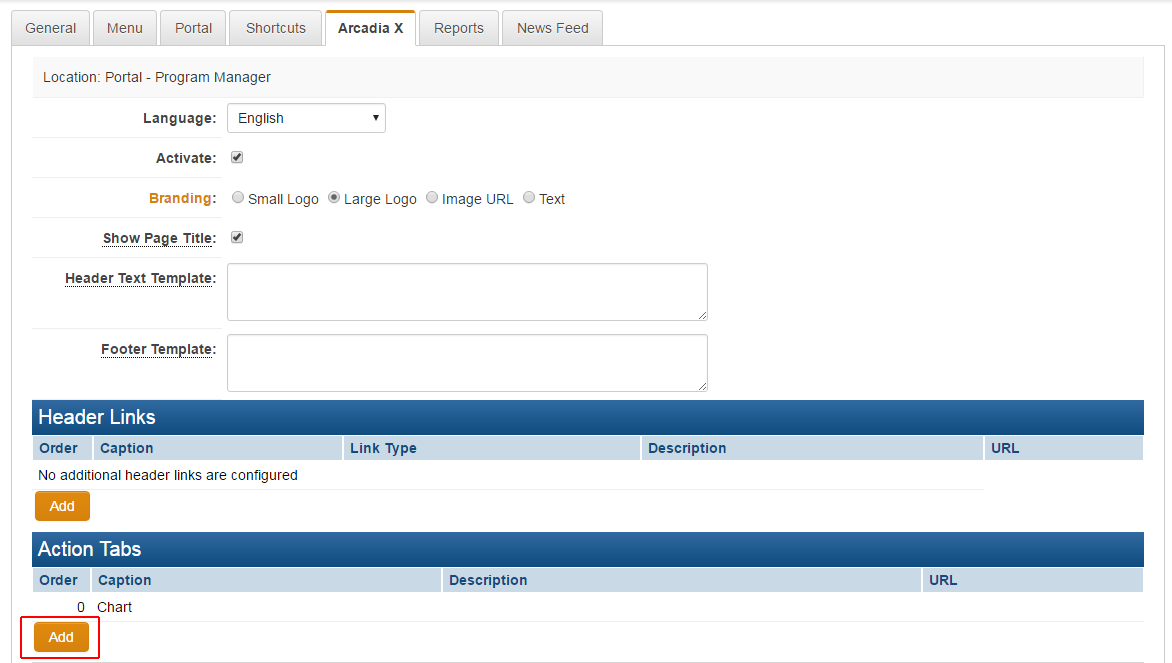
Go to Configuration > Roles & Permissions > User Roles
Click the Edit button on the desired role with an Arcadia X portal.
Create an Action Tab for the chart and choose the Content Type of Sections then Save.
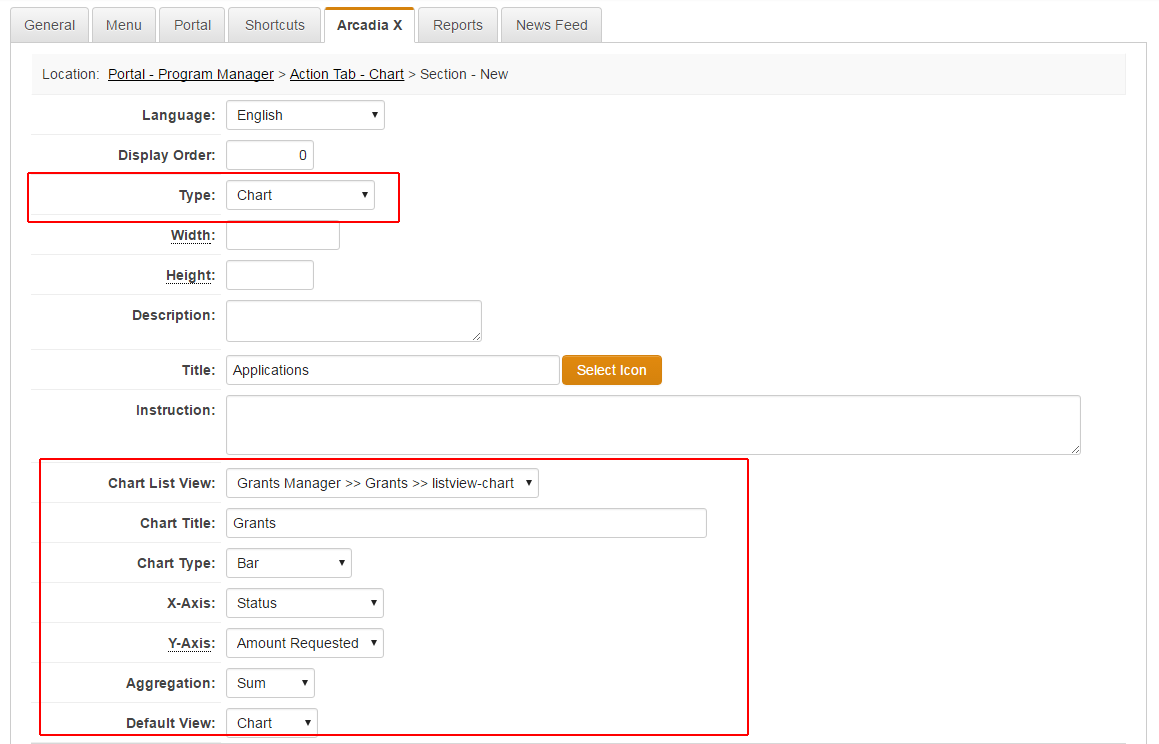
Choose the Type of Chart, Chart List View, Chart Type, X-Axis and Y-Axis as well as the Aggregation type and click Save.
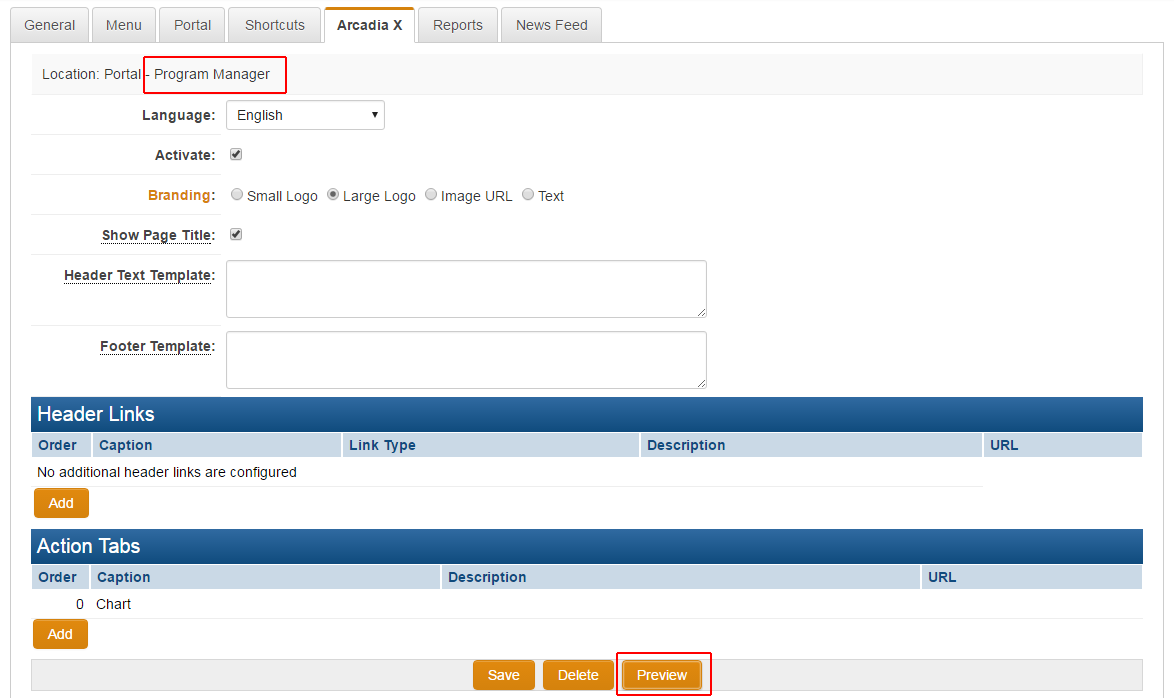
Preview your Arcadia X section.
