BI Dashboard
Revision as of 15:39, 19 December 2016 by Ciaran Donnelly (talk | contribs) (→Configuring BI Dashboard)
Revision as of 15:39, 19 December 2016 by Ciaran Donnelly (talk | contribs) (→Configuring BI Dashboard)
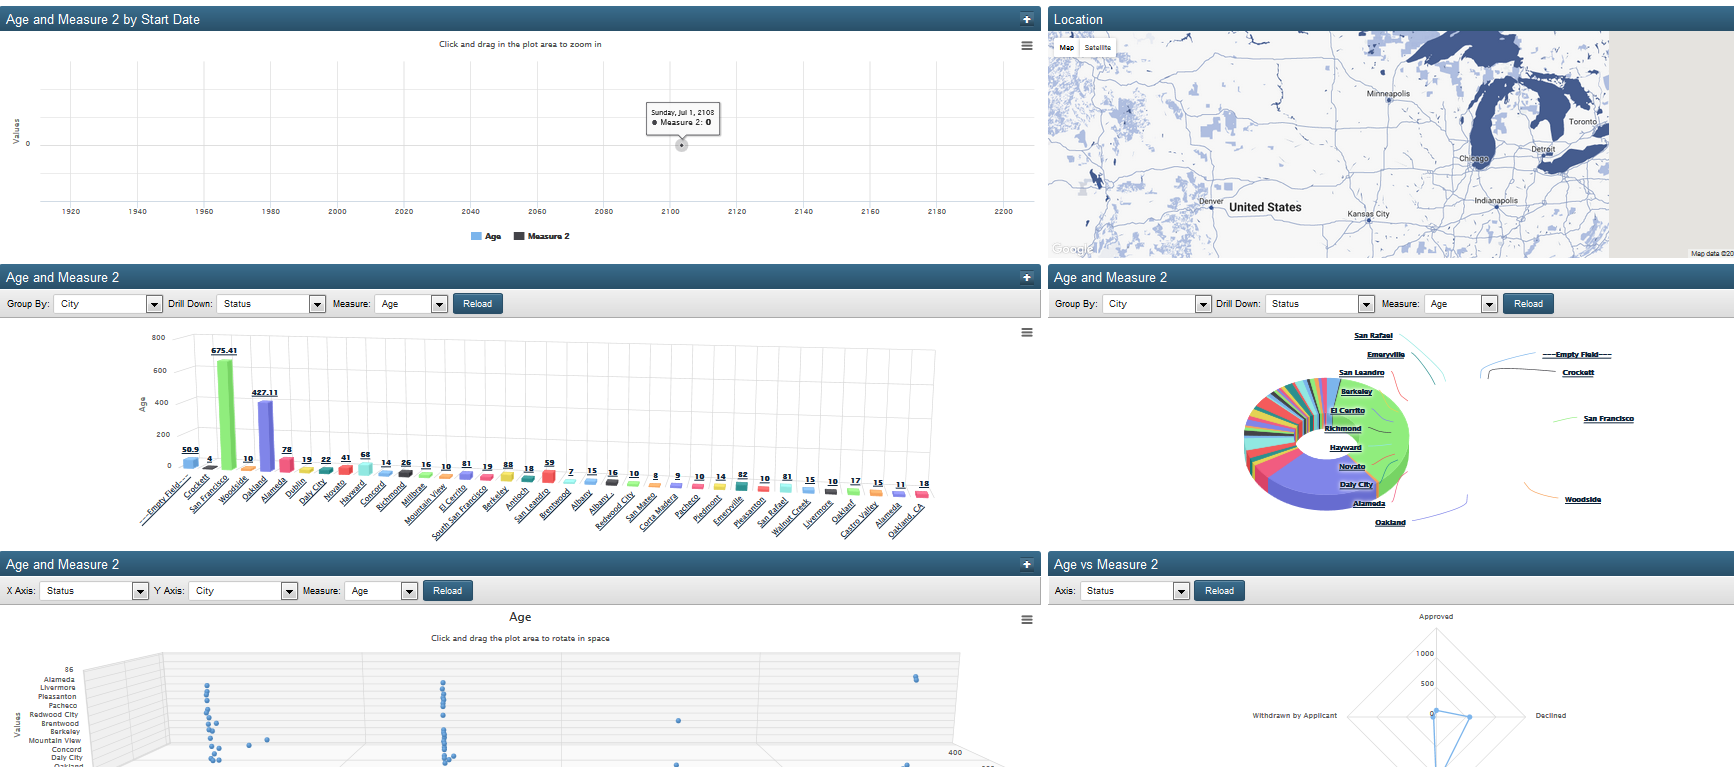
The BI Dashboard is a pre-defined dashboard for simple business intelligence.
It allows users to easily create a 6-chart dashboard, helping to visualise and analyse data.
Configuring BI Dashboard
- Navigate to the relevant UTA and access the UTA Settings - General tab.
- Click on the BI Dashboard hyperlink.
- Click on New BI Dashboard button.
- Populate relevant fields in the New BI Dashboard Settings page. The settings include
- Name: name of the dashboard
- Description: description of the dashboard
- Record Filtering - Status Filter: data displayed on the dashboard will be based on the records with the selected statuses
- Record Filtering - Type Filter: data displayed on the dashboard will be based on the records with the selected types
- Chart Fields - Start Date: selected field that will show the different Start Dates for the returned data
- Chart Fields - End Date: : selected field that will show the different End Date for the returned data
- Chart Fields - Fields to Group By: select a set of fields that you wish to aggregate the charts through
- Chart Fields - Fields to Measure: select a set of fields to use as measurements in the charts
- Click Save.
- The Link to Dashboard field will now be populated with a link. This link can be used to create Home pages or links.
