Impact Map
From SmartWiki
Revision as of 09:10, 15 August 2019 by Dan Eardley (talk | contribs)
Overview
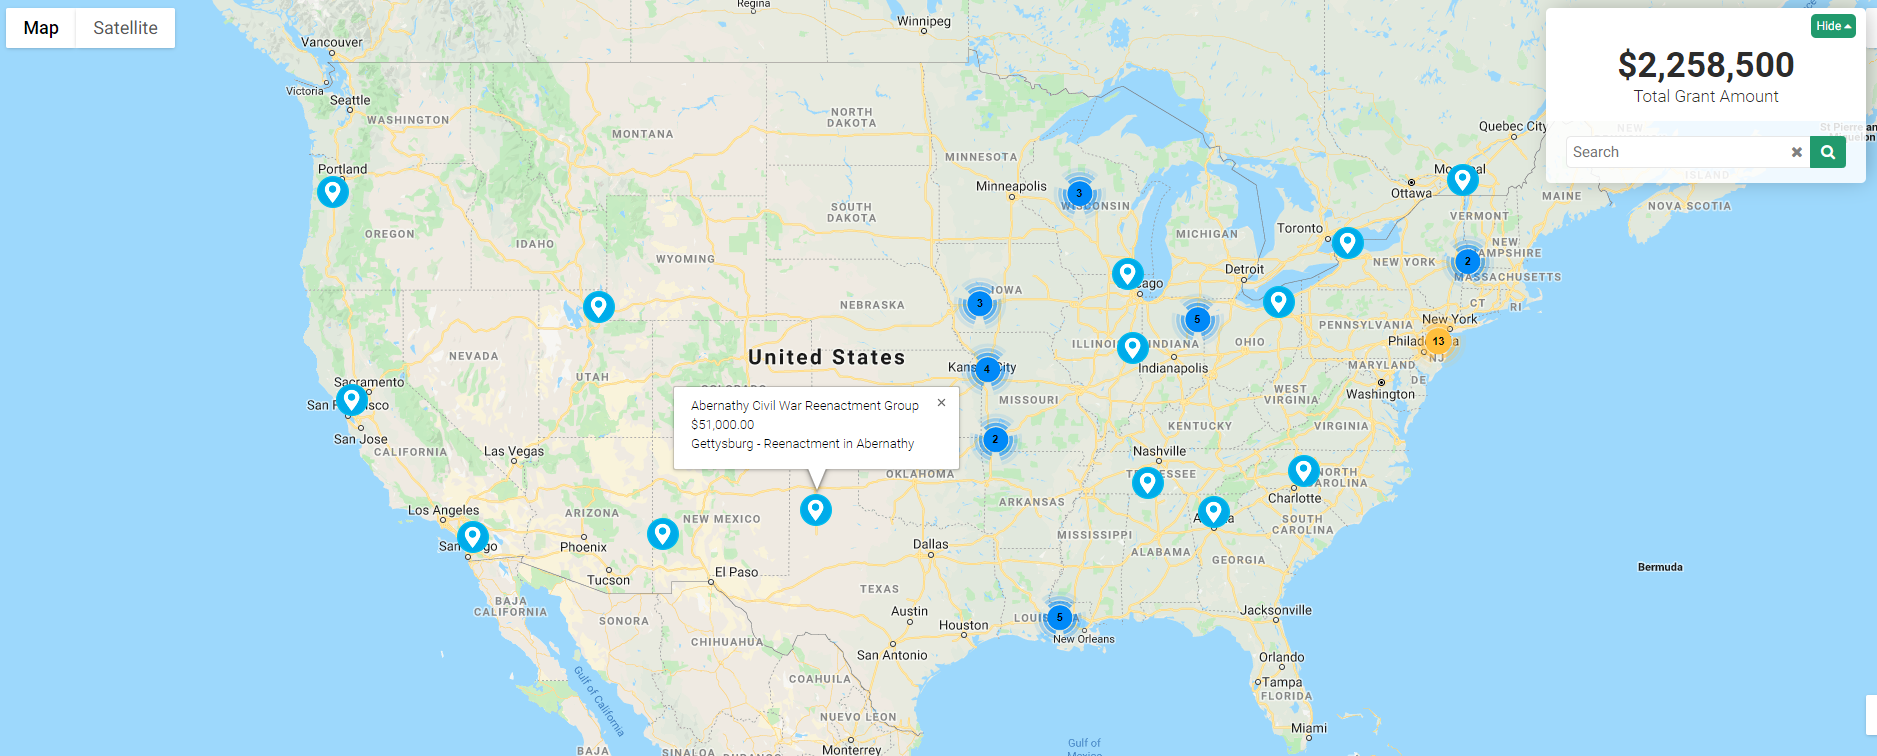
The Impact Map is a feature that can be used to plot records from a UTA on a map interface to display locations from the UTA records.
Configuration
- Choose the UTA the map will be associated with based on the types of records you want to present on the map. For this example, we will be using Level 2 records from a UTA, but the feature is also available on Level 1 records.
- In order for records to be plotted on the map, the use of the standard fields 'Latitude' and 'Longitude' must be enabled on your records. Review your records' standard fields, and enable these fields if not completed previously.
- You can define the Latitude and Longitude field values by utilizing the Geocode Field Mapping feature detailed on the Configuring_the_Level_2_Entity page.
- Note: The values for Latitude and Longitude must be stored to the record by either saving the record or using the 'Retrieve Latitude/Longitude' workflow task type.
- In the UTA Settings, go to the Level 2 tab and select the 'Impact Map Settings' link.
- Create a new map using the (+) button in the menu. Enter the map settings details based on the available parameters below.
- Name: The name of the map you are creating.
- Description: Used for storing additional detail about the map.
- Type Filter: Filters the records being plotted on the map based on the record type.
- Status Filter: Filters the records being plotted on the map based on the record status.
- Amount Field: The field that will be used in an aggregate sum displayed on the map (Grant Total: $###).
- Zoom Level: The level of zoom defined for loading the page on the Zoom Center you select.
- Zoom Center: The location on the map that the map will default in loading.
- Auto Zoom: This option will automatically load the map zoomed in on the area where records exist. If selected, the Zoom Level and Zoom Center are not utilized.
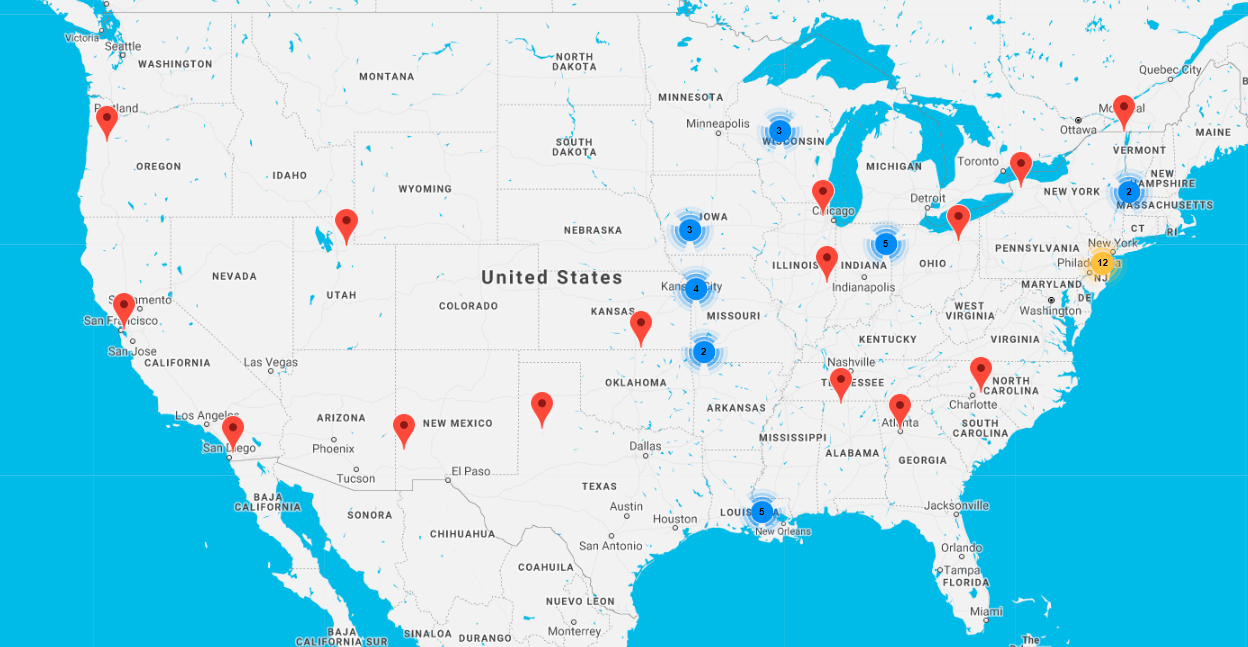
- Map Theme: The style of the map that will be displayed.
- Marker URL: This can be utilized to reference an image file for use as the map markers in place of the default Google Maps marker. This is not required if you want to use the default marker.
- Information Fields: Select the fields from the UTA record that you want displayed in the information box that will be displayed when selecting a marker on the map.
- Information Template: This can be utilized if you plan to use a custom template for the Information Fields display on the map. This is not required.
- KML: You can add references to KML files for your map so that KML overlays can be applied to the map. This is not required.
- SmartFolder: You must select a SmartFolder where the map files will be stored to within your SmartSimple instance.
- Once you have entered all of the settings for the map, save the map.
- Click the 'Generate HTML and JSON files' button to create the required files that will be stored to your selected SmartFolder. The HTML file URL will be accessible in the Impact Map configuration page. This can be referenced for navigating to the map, and can be utilized in portal design by referencing the relative URL in a custom page or custom portal section (Example: /files/368847/f304276/11_impactmap.html).
- Create a new map using the (+) button in the menu. Enter the map settings details based on the available parameters below.
Impact Map Example
Additional Map Theme Styles
- Blue Water
- Light Grayscale
- Golden Brown
- Retro


