Difference between revisions of "Allocation Chart"
From SmartWiki
| Line 21: | Line 21: | ||
==Examples== | ==Examples== | ||
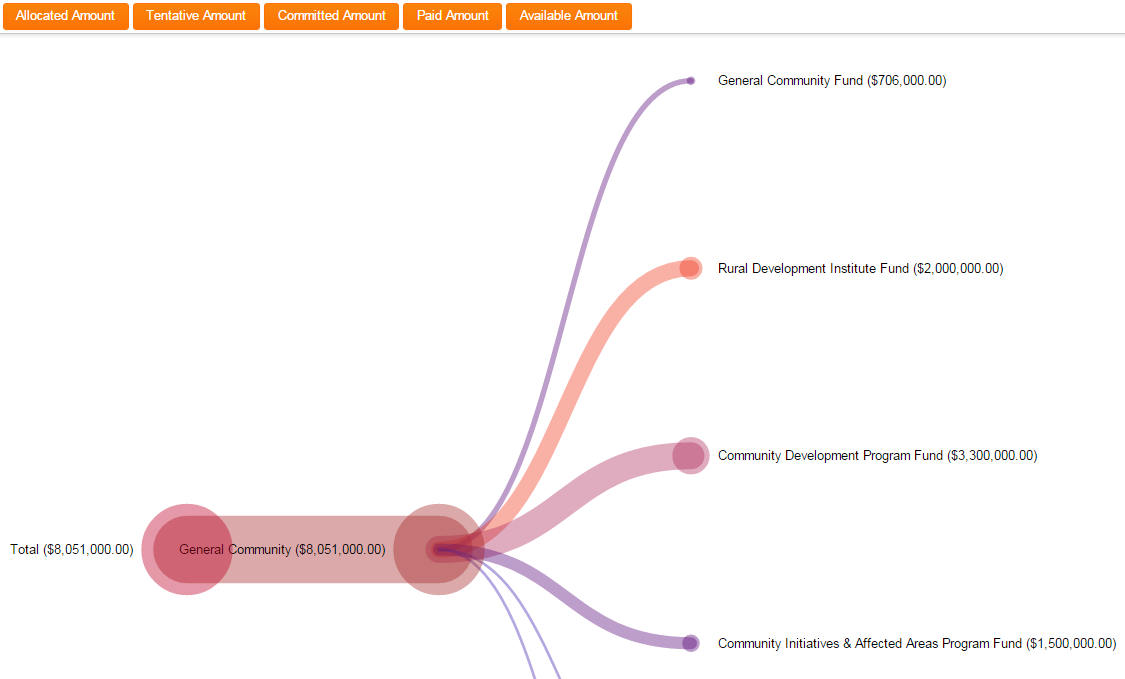
'''One fund view example'''<br /> | '''One fund view example'''<br /> | ||
| − | [[image:One_fund_allocation_chart_view.png| | + | [[image:One_fund_allocation_chart_view.png|700px]]<br /> |
<br /> | <br /> | ||
<br /> | <br /> | ||
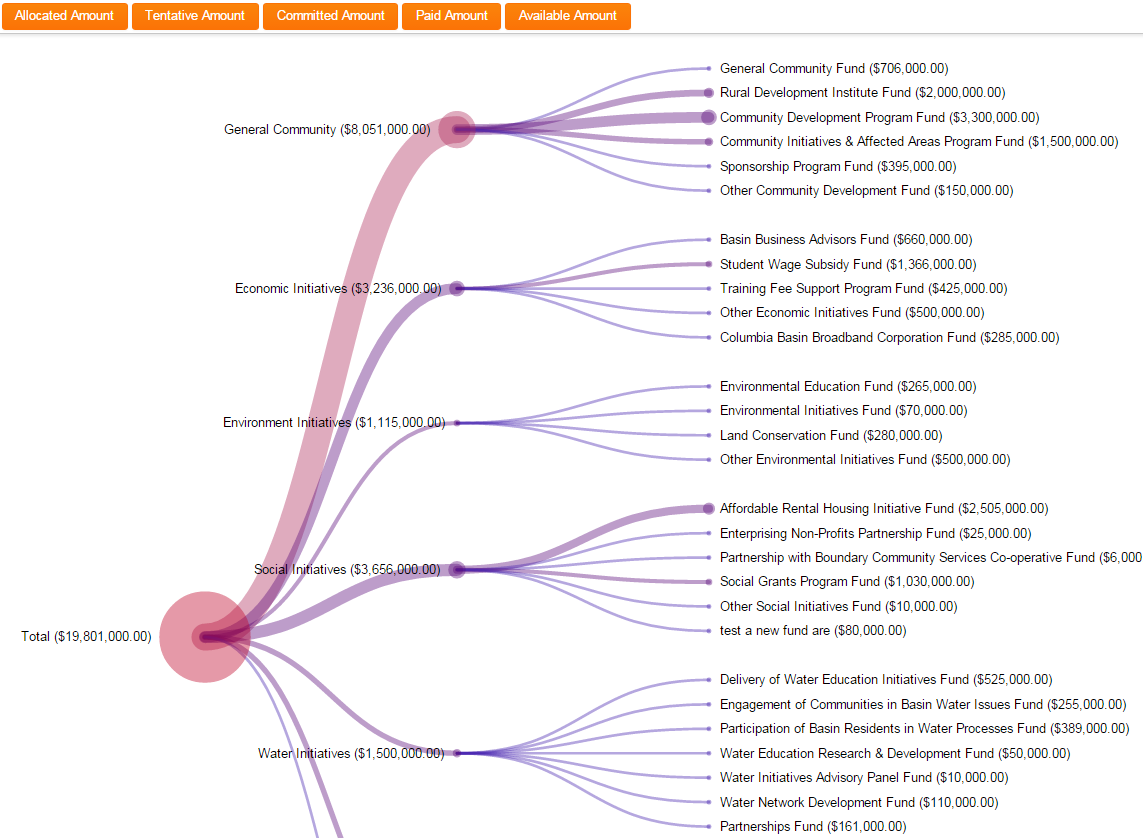
'''Multiple fund view example'''<br /> | '''Multiple fund view example'''<br /> | ||
| − | [[image:Many_fund_allocation_chart_view.png| | + | [[image:Many_fund_allocation_chart_view.png|700px]]<br /> |
<br /> | <br /> | ||
<br /> | <br /> | ||
| − | |||
| − | |||
| − | |||
| − | |||
| − | |||
Revision as of 09:45, 21 December 2015

|
This article will explain how you can implement this feature for use on your SmartSimple system. |
Overview
The Allocation Chart feature provides a graphic display of budget data and can include funds from one or many different funding pools.
- 1. Select the Budget Manager UTA
- 2. Select the budget or budgets to be included in the allocation chart
- 3. Notice that new icons have been added to the navigation menu. Click on the icon labeled Allocation Chart.
- 4. The Allocation Chart will be displayed
Examples

|
Click here to learn why this feature is a benefit to your organization. |


