Difference between revisions of "Summary Matrix"
From SmartWiki
(→Configuring the Summary Matrix) |
(→Configuring the Summary Matrix) |
||
| Line 9: | Line 9: | ||
==Configuring the Summary Matrix== | ==Configuring the Summary Matrix== | ||
| − | The default setting is to display [[Level 1 Templates]] (or [[Types|Level 2/3 Types]] for Summary Matrices on Level 2 or 3) as the row headings and [[status]]es as the column headings in the cross-tab view. | + | The default setting is to display [[Level 1 Templates]] (or [[Types|Level 2/3 Types]] for Summary Matrices on Level 2 or 3) as the row headings and [[status]]es as the column headings in the cross-tab view. |
| − | {{SettingsButton}} | + | |
| + | To configure other [[standard fields]] as the row headings, take the following steps: | ||
| + | # Click on the Settings button at the top right of the screen ({{SettingsButton}}) | ||
==Drilling Down into Your Data== | ==Drilling Down into Your Data== | ||
test | test | ||
[[Category:Arcadia]][[Category:Glossary]] | [[Category:Arcadia]][[Category:Glossary]] | ||
Revision as of 14:30, 13 September 2013
Overview
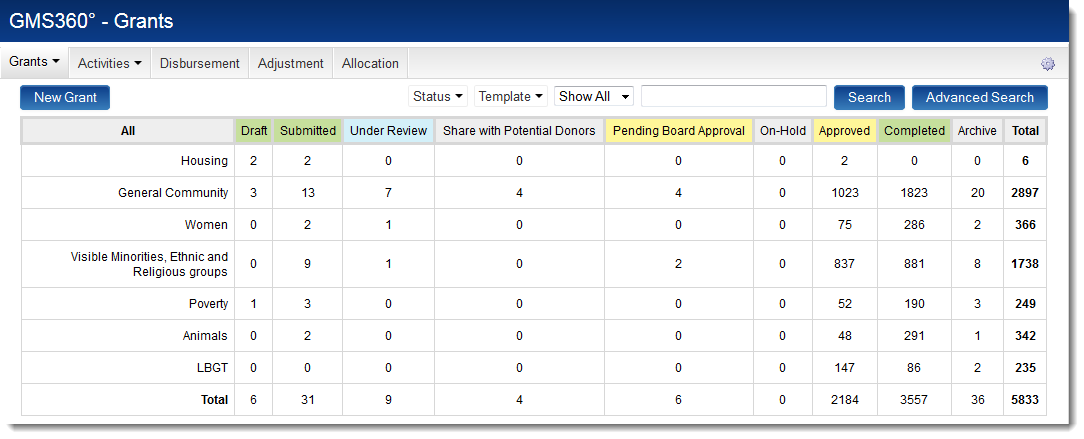
The Summary Matrix is a cross-tabbed view of your data in SmartSimple, with drill down options. This view allows users to immediately see the information that is useful or pertinent to them.
The Summary Matrix is available in SmartSimple's Arcadia interface and is configured using the Arcadia Settings page.
Configuring the Summary Matrix
The default setting is to display Level 1 Templates (or Level 2/3 Types for Summary Matrices on Level 2 or 3) as the row headings and statuses as the column headings in the cross-tab view.
To configure other standard fields as the row headings, take the following steps:
- Click on the Settings button at the top right of the screen (
 )
)
Drilling Down into Your Data
test