Using Total Group Options in Report Builder
The Total Group By options are intended to make it easier for users to implement aggregation or grouping in reports, and to get overall totals displayed.
In the example below the report is pulling in information related to the number of organizations. It is grouped initially by Country and then by State/Province.

The report provides an overall Grand Total at the bottom of the page regardless of Country or State. In the example shown below there are 817 organizations regardless of country.
It also provides totals based on the first column defined as Total Group by. In our example below the first column defined as Total Group by is the Country field, so the report shows there are a total of 812 organizations within the United States.
It also provides further breakdown within groupings based on any additional Total Group by columns defined. In our example below we only have State/Province as the additional Total Group by column. The report shows that there are a total of 2 Organizations in Wyoming and 18 in Wisconsin, and this data is displayed within the overall country data.
Configuration
The required steps when configuring these type of reports are . . .
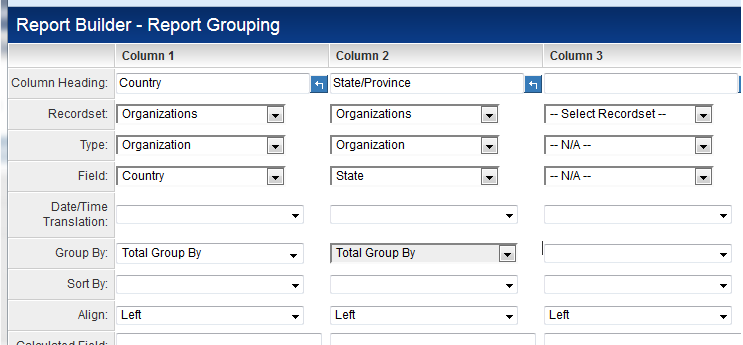
1. Specify columns to be Total Group by: Users can set as many as they want but they'll have to be set in order that the groupings will work. For example, if you want to group first by Country then have further breakdowns based on State/Province then you would have the Country column before the State/Province column, and select the "Total Group by" option against both.
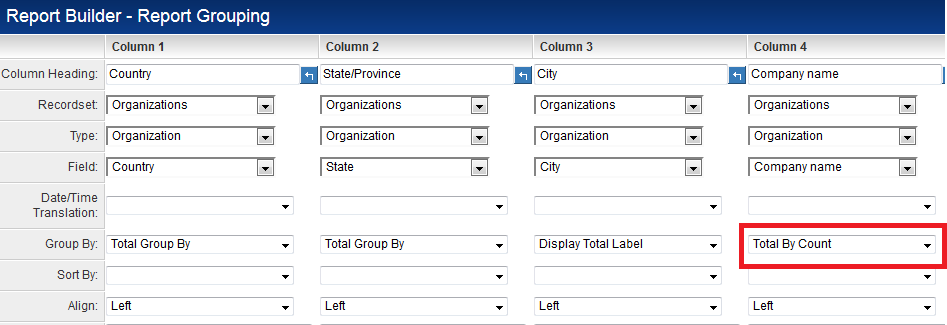
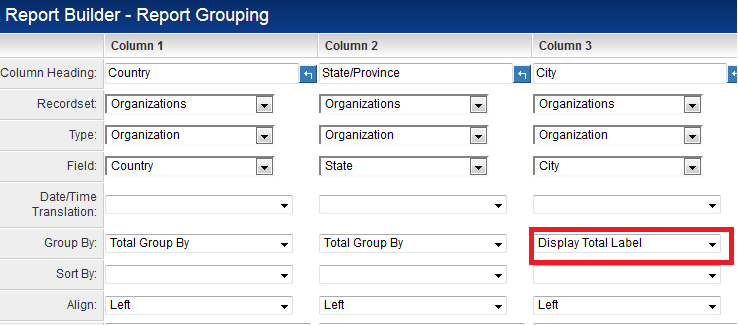
2. Specify a column to Display Total Label: User must define a column to display the label for the Total captions. If this is not defined then the report will give errors when run. In the example shown we are using the City column to display the labels.
When the resulting report generates the Totals will all be organized under the City column.

NOTE: The Total text will always be right aligned.
3. Specify columns for aggregations: There are a number of options for aggregating the data e.g.
- Total Group Sum - Total of a numeric field.
- Total Group Count - Count the number of occurrences.
- Total Group Average - The average of a numeric field.
- Total Group Standard Deviation - The standard deviation of a numeric field.
In the example shown we are counting the number of Organizations.


